
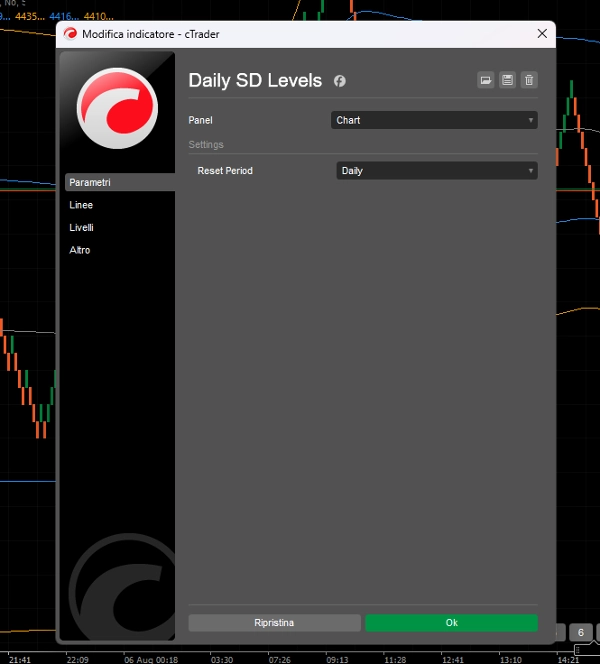
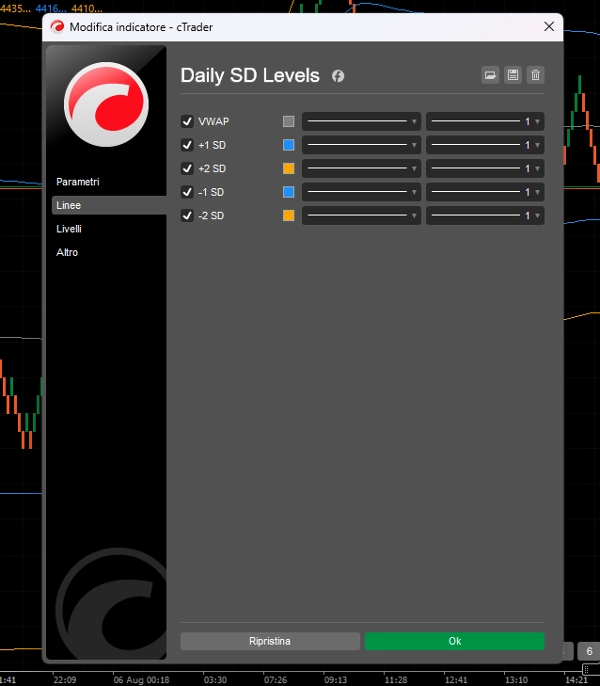
Daily SD Levels - Indicator
Wskaźnik
4 zakupy
Wersja 1.0, Aug 2025
Windows, Mac
5.0
Opinie: 1
Opis
Codzienne Poziomy SD – Dynamiczne Wstęgi Odchylenia Standardowego oparte na VWAP
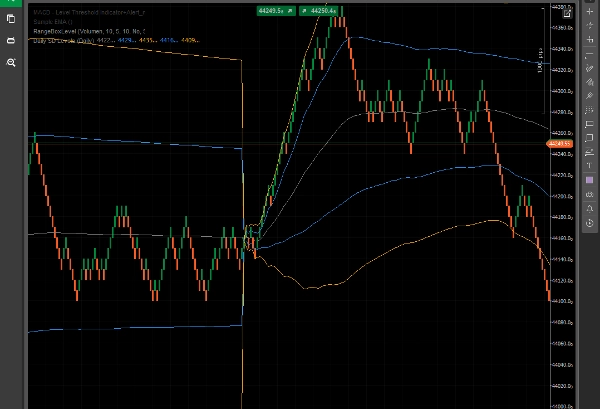
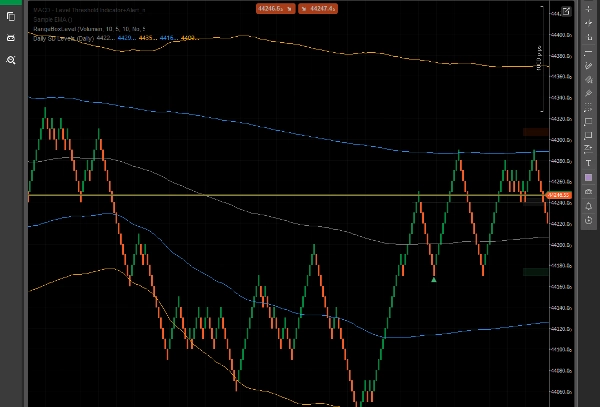
Wskaźnik Codzienne Poziomy SD wyświetla dynamiczne VWAP (Średnia Ważona Wolumenem) oraz Wstęgi Odchylenia Standardowego (+1/+2 i -1/-2) obliczane dla bieżącego dnia handlowego.
To narzędzie pomaga traderom wizualnie ocenić zmienność wewnątrzdzienną, potencjalne strefy wsparcia/oporu oraz ekstrema cenowe, wszystko oparte na rzeczywistym wolumenie rynku i ruchach cen – nie na stałych ani arbitralnych poziomach.
Kluczowe cechy:
- Linia VWAP do śledzenia wartości godziwej wewnątrzdziennie.
- Wstęgi SD +1/+2 i -1/-2 do identyfikacji stref wykupienia/wyprzedania.
- Poziomy resetują się codziennie, dostosowując się do dynamiki cen i wolumenu każdej sesji.
- Optymalizowany dla Renko, Range Bar i handlu wewnątrzdziennego.
- Stworzony dla traderów potrzebujących jasnych i dynamicznych stref cenowych.
Ten wskaźnik jest idealny dla:
- Strategii powrotu do średniej.
- Identyfikacji rozciągniętych ruchów pod kątem możliwych odwróceń.
- Wizualnego potwierdzenia wybicia poza granice statystyczne.
Brak bałaganu. Tylko czyste, responsywne poziomy, które poruszają się wraz z rynkiem.
Podsumowanie
Profil wskaźnika
Opinie klientów
5.0
Opinie: 1
5 | 100 % | |
4 | 0 % | |
3 | 0 % | |
2 | 0 % | |
1 | 0 % |
Opinie klientów
August 8, 2025
it gives context without making the decision, but the chart still needs a human read.
Dyskusja
Częste pytania
Produkty dostępne za pośrednictwem cTrader Store, w tym boty handlowe, wskaźniki i wtyczki, dostarczane są przez deweloperów zewnętrznych i udostępniane wyłącznie w celach informacyjnych oraz w celu zapewnienia dostępu technicznego. cTrader Store nie jest brokerem i nie zapewnia doradztwa inwestycyjnego, nie udziela spersonalizowanych rekomendacji ani nie gwarantuje przyszłych wyników.


Cena
Od 16/07/2025
5
Sprzedaż