
Smart Floating Risk Pro
指标
1 购买
版本 1.0, Jul 2025
Windows 版、Mac 版
5.0
评价:1
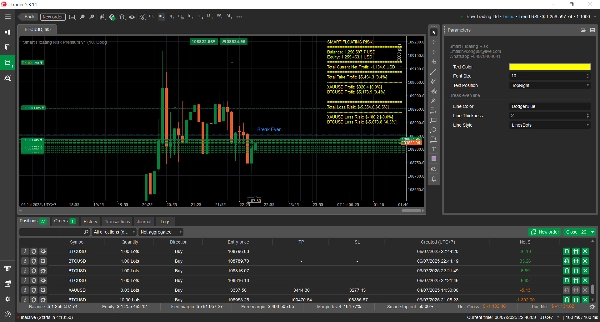
📊 Smart Floating Risk Pro – 适用于 cTrader 的高级风险管理工具
Smart Floating Risk Pro 是流行的 Smart Floating Risk - Premium 指标的下一代升级版,专为需要实时全面控制风险敞口的交易者设计。该强大工具专为 cTrader 打造,超越了基本的风险跟踪,提供 全面、直观且可操作的浮动风险视图,直接显示在您的图表上。
新增功能包括 盈亏平衡线、综合止盈预测 以及改进的风险计算,Smart Floating Risk Pro 确保您始终领先一步,安全有效地管理交易。
🆕 Smart Floating Risk Pro 的新功能:
- ✅ 盈亏平衡线:图表上自动显示的清晰线条,标示您的平均入场点——即时查看您的持仓何时转为盈利。
- ✅ 综合止盈显示:在单一合并视图中直观展示所有未平仓交易的总预计利润。
- ✅ 改进的止损处理:修正了之前对具有正止损距离交易的亏损计算不准确的问题。
- ✅ 错误修复与优化:提升了所有浮动风险指标的准确性和性能。
💡 核心功能:
- 🔸 实时浮动风险显示
以 货币价值 和 账户余额百分比 两种形式查看当前浮动风险。 - 🔸 直观风险洞察
通过图表直接显示风险指标,立即了解您的风险敞口——无需手动计算。 - 🔸 自定义提醒
当浮动风险超过您设定的阈值时收到通知,帮助您保持交易纪律。 - 🔸 无缝集成
兼容任何交易策略——无论您交易外汇、指数、加密货币还是商品。 - 🔸 用户友好且可定制
为各级交易者设计,提供清晰的视觉效果和可调参数,满足您的偏好。
✅ 为什么选择 Smart Floating Risk Pro?
风险管理是长期交易成功的基础。 Smart Floating Risk Pro 不仅简化了风险监控,还增加了 有意义的背景信息——帮助您果断且自信地采取行动。无论您是初学者还是专业人士,该工具都能让您专注于最重要的事情:保护资本,同时追求稳定回报。
聪明交易,掌控全局。使用 Smart Floating Risk Pro 升级您的风险管理。
指标配置
5.0
评价:1
5 | 100 % | |
4 | 0 % | |
3 | 0 % | |
2 | 0 % | |
1 | 0 % |
客户评价
July 6, 2025
This is a super useful tool: it lets you quickly visualize risk and manage stacked trades more effectively.
cTrader Store 提供的所有产品,包括交易机器人、指标和插件,均由第三方开发者提供,仅供信息参考和技术访问之用。cTrader Store 并非经纪商,不提供投资建议、个人推荐或任何未来业绩保证。
该作者的其他作品


!["Gaussian Channel [Iridio Capital]" 标识](https://cdn.ctrader.com/image/webp/7c039209-5573-4a54-a072-f9528b503103_41960)


注册日期 29/11/2024
32
销售
963
免费安装