
Descrição
📊 TrendHeikinMultiMA – Algoritmo Avançado de Tendência
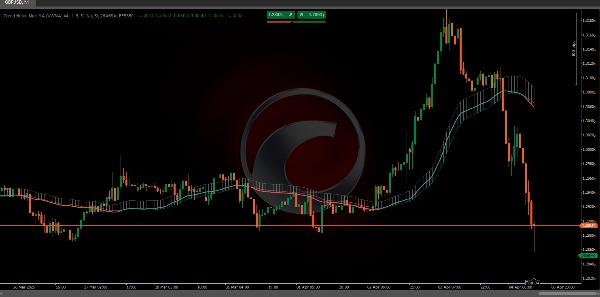
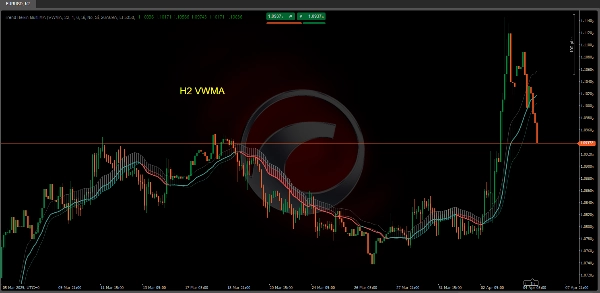
O algoritmo TrendHeikinMultiMA foi projetado para calcular valores de tendência a partir dos dados de preço, usando a fórmula Heikin-Ashi para suavizar esses valores e aplicando diferentes tipos de médias móveis (ALMA, HMA, SMA, SWMA, VWMA, WMA, ZLEMA ou EMA).
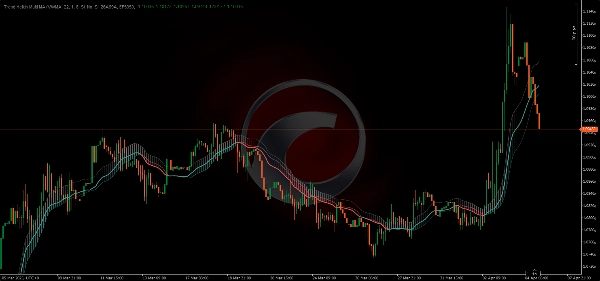
Embora os valores Heikin-Ashi sejam usados internamente, o gráfico não exibe as velas tradicionais Heikin-Ashi. Em vez disso, ele desenha linhas de tendência baseadas nos valores suavizados, facilitando a interpretação da direção do mercado sem a complexidade visual dos gráficos de velas.
🔄 1. O Papel da Suavização
Como os valores de tendência são derivados da suavização Heikin-Ashi combinada com uma média móvel, a mudança de cor no TrendHeikinMultiMA não ocorre imediatamente quando o preço cruza a linha de tendência:
- 🔹 O preço pode se mover temporariamente acima ou abaixo da linha de tendência sem disparar uma mudança de cor.
- 🔹 Isso acontece porque o indicador aguarda uma diferença significativa e sustentada entre os valores suavizados de abertura e fechamento para confirmar uma reversão real da tendência.
✅ Vantagem na Interpretação
Esse atraso intencional na mudança de cor ajuda a evitar sinais falsos. Em um gráfico de velas tradicional, o preço pode cruzar brevemente a linha de tendência e disparar sinais prematuros.
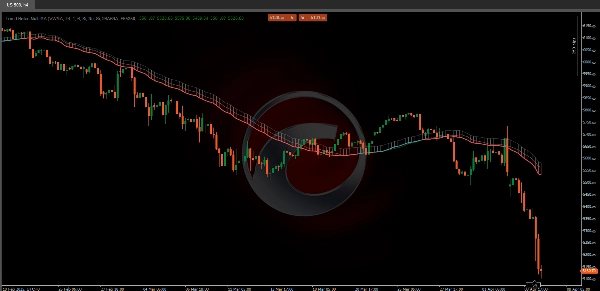
- 🟥 Por exemplo, mesmo que o preço atual esteja acima de uma linha de tendência de baixa, o indicador permanecerá vermelho (baixista) até que os valores suavizados confirmem que o fechamento está consistentemente acima da abertura.
- 🟩 Da mesma forma, para mudar para verde (altista), a média móvel baseada em Heikin-Ashi deve confirmar que o fechamento consistentemente supera a abertura.
📈 2. Aplicando Médias Móveis aos Valores Heikin-Ashi
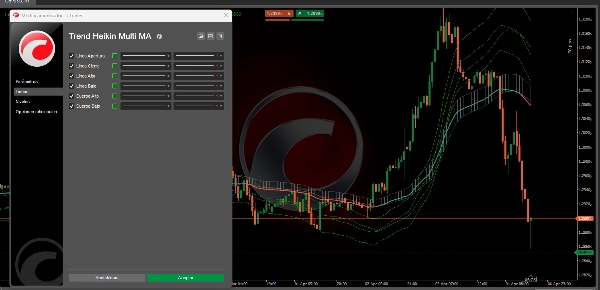
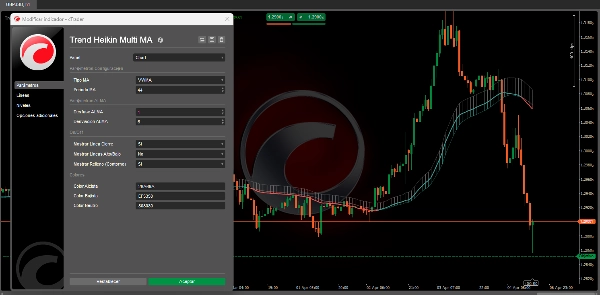
- 🔄 Seleção da Média Móvel:
-
- O usuário pode escolher entre diferentes tipos de médias móveis (ALMA, HMA, SMA, SWMA, VWMA, WMA, ZLEMA e EMA).
- Cada tipo de MM aplica um método matemático específico para ponderar e suavizar os valores históricos de abertura, fechamento, máxima e mínima derivados do Heikin-Ashi.
🏆 3. Vantagens de Usar TrendHeikinMultiMA vs. Velas Tradicionais
- 📉 Redução de Ruído:
-
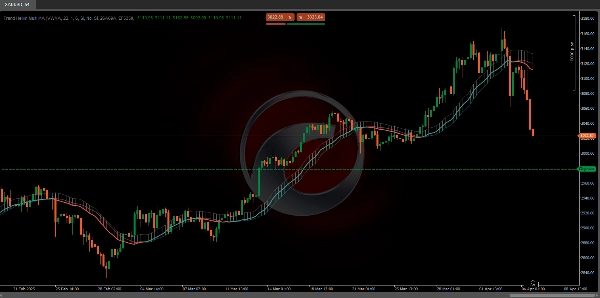
- Velas tradicionais frequentemente exibem alta volatilidade e dados dispersos, dificultando a identificação da tendência geral.
- TrendHeikinMultiMA suaviza esses dados, filtrando pequenas flutuações e eliminando oscilações abruptas, permitindo que os traders se concentrem na direção principal do mercado.
✅ Conclusão
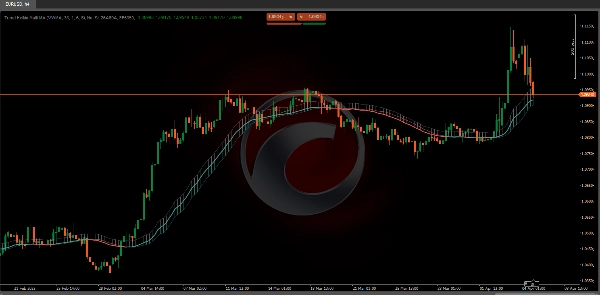
Em resumo, TrendHeikinMultiMA confirma uma mudança de tendência (altista ou baixista) somente quando os valores suavizados de abertura e fechamento—calculados a partir do Heikin-Ashi e processados pela média móvel selecionada—mostram consistentemente que o comportamento do mercado reverteu sua direção.
Isso garante que os sinais sejam mais confiáveis e menos afetados pelo ruído visto nos gráficos tradicionais de velas. 🚀📊
🔥 Indicadores da Pinescritlabs Ctrader Store 🔥
Dynamic Market Structure
Analysis of Turning Points
Fibonacci Linear
Regression Multi-timeframe
Multi-Level Candle Bias
Tracker
Auto Support and
Resistance Trend Lines
All Support and
Resistance Levels
Resumo
The indicator incorporates a smoothing mechanism that delays color changes to confirm trend reversals only after a significant and sustained difference between smoothed open and close values is detected. This approach reduces false signals caused by brief price fluctuations crossing trend lines.
Users can select from multiple moving average types, each applying distinct mathematical weighting methods to the Heikin-Ashi-derived open, close, high, and low values, enhancing customization and adaptability to different trading styles.
Compared to traditional candlestick charts, Trend Heikin Multi MA filters out minor price fluctuations and abrupt swings, allowing traders to focus on primary market trends with more reliable signals. It confirms bullish or bearish trend changes only when smoothed values consistently indicate a market direction reversal, improving signal accuracy and reducing noise.
Avaliações de clientes
5 | 33 % | |
4 | 67 % | |
3 | 0 % | |
2 | 0 % | |
1 | 0 % |


