
Descrição
Indicadores da loja Pinescriptlabs: cBots da loja Pinescriptlabs : (cBot) Gold & BTC BreakoutSession Pivots(novo)
Projeção de Liquidez de Preço ZigZag
Algoritmo Inteligente de Trailing (novo)
Mapa de Liquidação de Alavancagem
Previsão Baseada em Linreg & ATR
Suporte e Resistência SmartTrend
Linhas
Lines
Sistema de Rompimento de Canal
Análise
Dinâmica
da Estrutura de Mercado
de
Pontos
de Virada
Regressão
Linear
Fibonacci
Multi-temporal
Gap de Valor Justo de Momentum
Gradiente de Tendência Dinâmico
Rastreador de Extremos Zig-Zag
Suporte
e Resistência
Automáticos
de Tendência
Linhas
Todos
os Suportes
e Resistências
Níveis
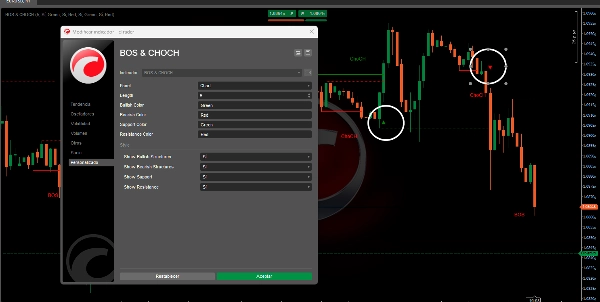
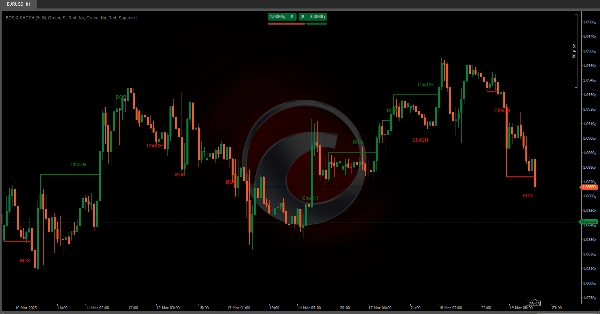
O algoritmo é projetado para identificar padrões estruturais de mercado , especificamente os conceitos de Mudança de Característica (ChoCH) 🔄 e Rompimento de Estrutura (BoS) 💥. Abaixo, explicarei em detalhes o que este algoritmo faz, seu propósito e como identifica esses dois conceitos.
O que o Algoritmo Faz?
O algoritmo usa fractais (máximas e mínimas locais) para determinar se o preço mudou seu comportamento ou rompeu uma estrutura previamente estabelecida. Abaixo estão as principais funcionalidades:
Detecção de Fractais 📊
- Um fractal de alta ocorre quando há uma máxima local onde as velas em ambos os lados são menores. 📈
- Um fractal de baixa ocorre quando há uma mínima local onde as velas em ambos os lados são maiores. 📉
- Esses fractais atuam como pontos de referência para identificar mudanças na estrutura do mercado.
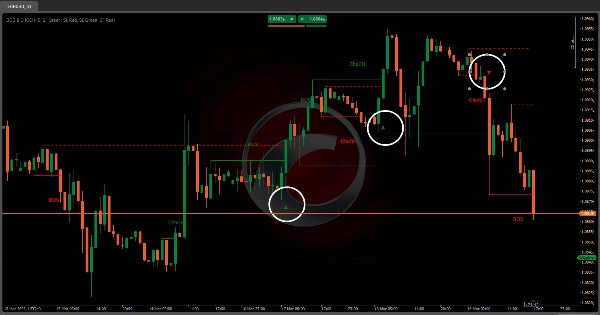
Identificação de ChoCH (Mudança de Característica) 🔄
- Um ChoCH de alta ocorre quando o preço ultrapassa um fractal de alta sem formar uma estrutura completa de baixa antes.
- Um ChoCH de baixa ocorre quando o preço cai abaixo de um fractal de baixa sem formar uma estrutura completa de alta antes.
- Isso indica que o mercado mudou seu caráter (de tendência para consolidação ou vice-versa).
Identificação de BoS (Rompimento de Estrutura) 💥
- Um BoS de alta ocorre quando o preço ultrapassa um fractal de alta após formar uma estrutura completa de baixa antes.
- Um BoS de baixa ocorre quando o preço cai abaixo de um fractal de baixa após formar uma estrutura completa de alta antes.
- Isso indica que o mercado rompeu uma estrutura previamente estabelecida, o que pode ser um ponto importante de entrada ou saída.
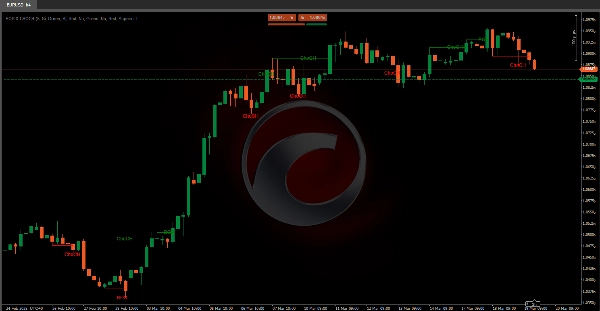
Visualização de Suporte e Resistência 🛡️
- O algoritmo pode desenhar linhas de suporte e resistência com base nos fractais detectados.
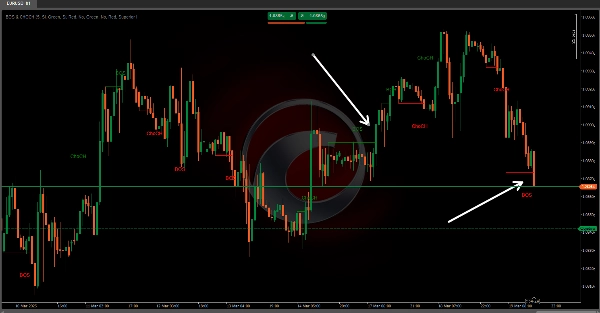
- Ele também verifica se essas linhas são rompidas, marcando os pontos de breakout com ícones visuais.
Este algoritmo fornece aos traders insights valiosos sobre o comportamento do mercado, identificando claramente mudanças estruturais chave e oportunidades potenciais de breakout. Ao aproveitar os sinais de ChoCH 🔄 e BoS 💥, os traders podem tomar decisões mais informadas sobre entradas, saídas e a dinâmica geral do mercado.
Resumo
Key functionalities include:
- **Fractal Detection:** Identifies bullish fractals (local highs with lower candles on both sides) and bearish fractals (local lows with higher candles on both sides).
- **Change of Character (ChoCH):** Signals when the market changes its behavior, such as shifting from trend to consolidation, by surpassing fractals without forming a complete opposite structure.
- **Break of Structure (BoS):** Indicates when the market breaks a previously established structure, marking potential entry or exit points.
- **Support and Resistance Visualization:** Draws support and resistance lines based on fractals and marks breakout points with visual icons.
This indicator aids traders in understanding market dynamics by clearly highlighting structural changes and breakout opportunities, supporting more informed trading decisions.
Avaliações de clientes
5 | 100 % | |
4 | 0 % | |
3 | 0 % | |
2 | 0 % | |
1 | 0 % |


