
Descrição
🔍 Examina dados de volume ao longo de um período histórico específico, destacando áreas potenciais onde investidores altamente alavancados podem enfrentar liquidações, fornecendo insights valiosos sobre o comportamento do mercado.
O que este indicador faz?
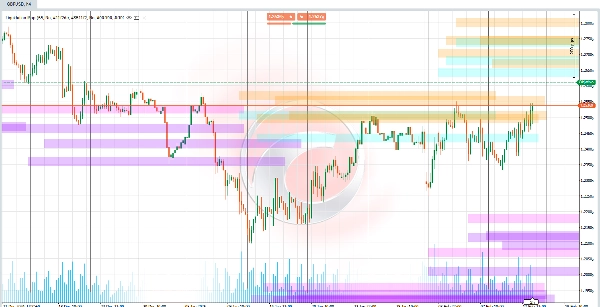
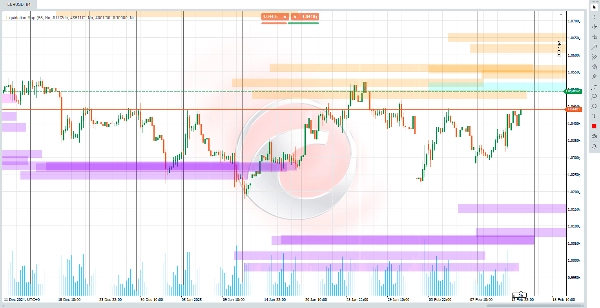
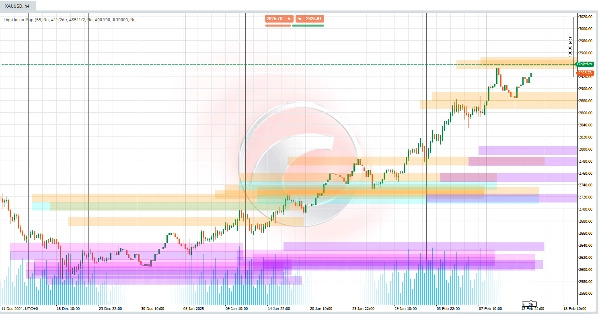
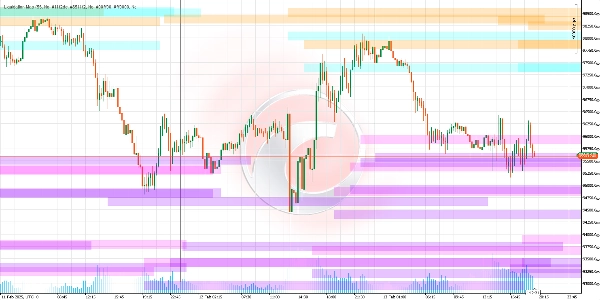
Este algoritmo identifica níveis de preço onde liquidações massivas de posições alavancadas (como 5x, 10x, 25x, 50x ou 100x) provavelmente ocorrerão. Esses níveis atuam como "ímãs" para movimentos de preço, pois as liquidações podem desencadear oscilações bruscas no mercado. O indicador desenha linhas horizontais no gráfico, representando esses limiares e projetando-os para o futuro para antecipar zonas-chave de interesse.
Como esses níveis são calculados?
- Detecção de Pivôs de Preço:
🔄 Identifica máximas e mínimas recentes no gráfico (pontos onde o preço muda de direção). Esses pivôs são a base para calcular os níveis de liquidação. - Volume como Gatilho:
📊 Compara o volume atual com uma média histórica. Se o volume ultrapassar certos limiares (por exemplo, 1,2x a média para 100x), ativa os níveis correspondentes de liquidação. - Fórmula de Liquidação:
Quanto maior a alavancagem, mais próximo o nível de liquidação está do preço atual. -
- Para posições longas: O nível de liquidação é definido abaixo do pivô baixo, calculado com base na alavancagem (por exemplo, 2% abaixo para 50x).
- Para posições curtas: O nível é definido acima do pivô alto, usando o mesmo princípio.
O que você pode esperar ao usá-lo?
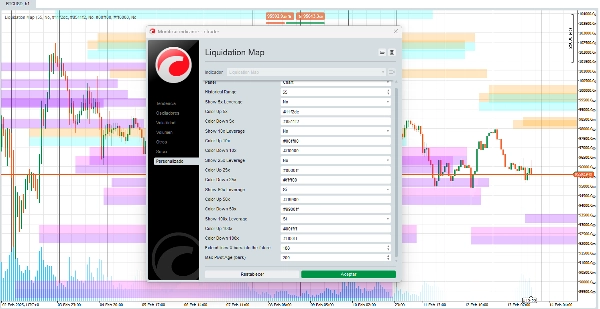
- Linhas de Liquidez: 🎨 Você verá linhas horizontais personalizáveis representando zonas onde o mercado pode experimentar alta volatilidade devido a liquidações.
- Alavancagens Configuráveis: ⚙️ Você pode ativar/desativar níveis para cada tipo de alavancagem (por exemplo, focar apenas em 50x e 100x).
- Personalização de Cores: 🌈 Você pode escolher a cor para cada faixa de liquidação, adaptando a visualização às suas preferências.
- Zonas de Congestionamento: 🎯 Múltiplas linhas próximas sugerem áreas de alto risco/alta recompensa onde múltiplas liquidações podem ocorrer simultaneamente.
Como interpretar os sinais?
- Preço se Aproximando de uma Linha: 🚨 Se o preço se aproxima de um nível de liquidação (especialmente com alto volume), a probabilidade de um movimento brusco aumenta.
- Cor e Transparência: 🎨 As cores variam conforme a alavancagem (por exemplo, azul para 25x, laranja para 50x). A transparência indica a "força" do volume associado (linhas mais escuras = volume mais significativo).
Por que é útil?
- Previsão Proativa: 🔮 Não analisa apenas o passado; projeta níveis futuros com base nas condições atuais.
- Foco na Psicologia do Mercado: 🧠 Liquidações forçadas frequentemente criam reações em cadeia (por exemplo, ordens de stop-loss acionando mais vendas). Este indicador ajuda você a antecipá-las.
- Personalização: 🛠️ Adapte a visualização à sua estratégia (por exemplo, priorizar alavancagens maiores em mercados voláteis).
Limitações a considerar
- Dependência de Volume: 📉 Se o volume for baixo ou os dados históricos forem insuficientes, os sinais podem ser menos confiáveis.
- Não é uma Bola de Cristal: 🔮 Os níveis indicam zonas prováveis, não certezas. Sempre combine com outras análises.
- Ambiente Dinâmico: 🌍 Em mercados com notícias inesperadas, liquidações podem ocorrer fora dos níveis projetados.
Indicadores da Ctrader Store:
Dynamic Market Structure
Analysis of Turning Points
Fibonacci Linear
Regression Multi-timeframe
Multi-Level Candle Bias
Tracker
Auto Support and
Resistance Trend Lines
Resumo
Avaliações de clientes
5 | 67 % | |
4 | 0 % | |
3 | 33 % | |
2 | 0 % | |
1 | 0 % |


