
Descrição
🚀 Sistema de Rompimento de Canal
Este algoritmo especializado foi projetado para confirmar pontos de entrada e saída com precisão 🎯 combinando múltiplos elementos de análise técnica para fornecer sinais confiáveis.
🔍 Como Funciona?
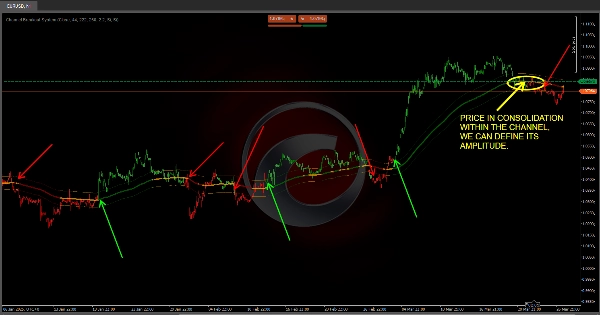
📊 Canal Baseado em Volatilidade (ATR)
✅ A volatilidade do mercado é calculada usando o ATR (Average True Range) 📉.
✅ A "Trend MA" é ajustada adicionando e subtraindo um valor proporcional a essa volatilidade, formando duas linhas pontilhadas que atuam como um "teto" e "chão" do mercado.
✅ O que isso significa para você? Se o preço permanecer dentro do canal, o mercado pode estar em consolidação ou lateralização; se romper claramente, é um sinal de um movimento de tendência forte 📈📉.
✅ Totalmente personalizável! Ajuste as configurações do canal para combinar com sua estratégia 📌.
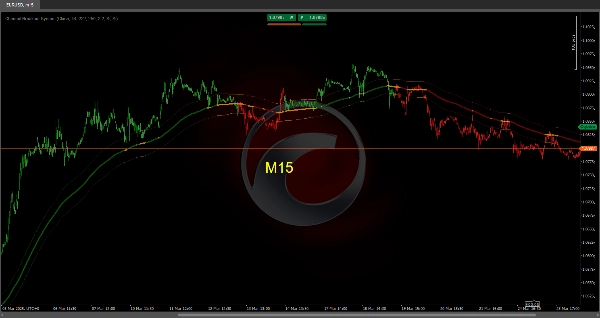
🟢 Detecção de Tendência com Cores Inteligentes
🔹 O indicador compara a posição da MA rápida com a MA média, e ambas em relação à Trend MA.
🔹 Com base na fase do mercado, as velas mudam de cor:
- 🟢 Verde → Fase de mercado altista.
- 🔴 Vermelho → Fase de mercado baixista.
- 🟠 Laranja ou neutro → Possível consolidação ou incerteza.
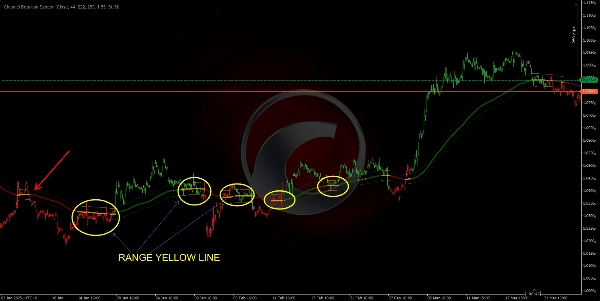
🔹 Se o preço e as médias móveis estiverem "presos" dentro do canal, isso sinaliza uma fase de consolidação, ajudando você a evitar negociações em zonas indecisas.
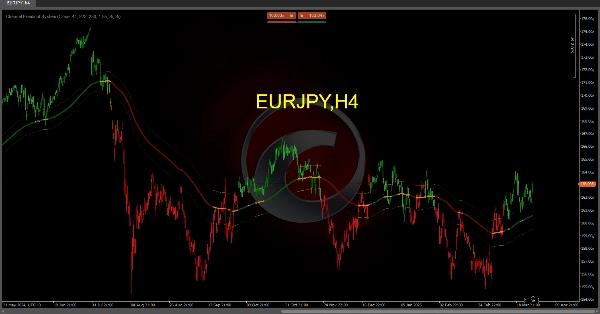
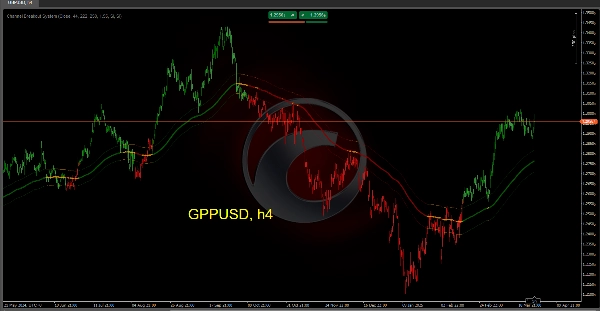
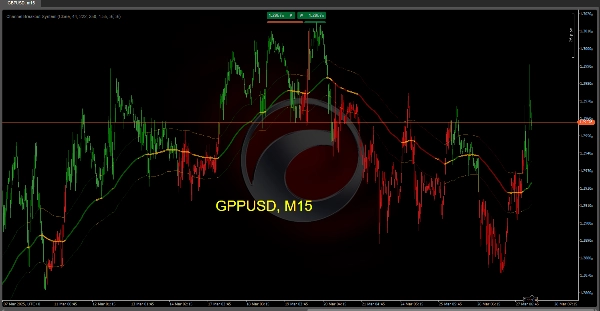
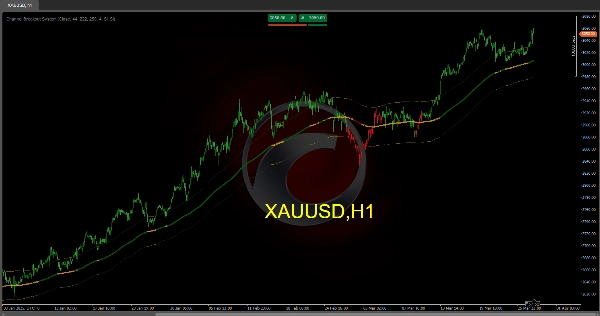
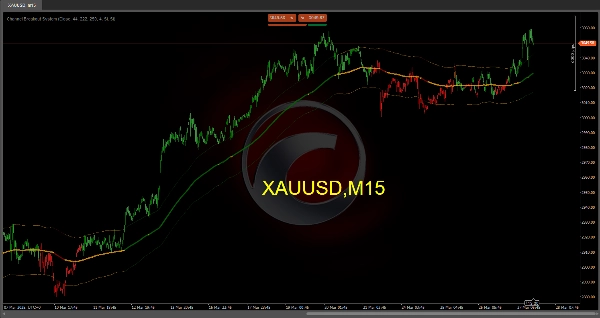
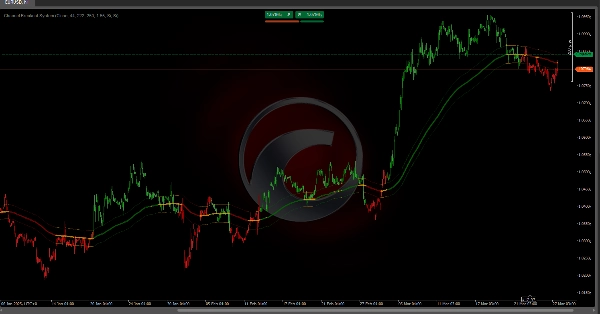
🎯 Como Parece no Gráfico
🔵 Linha de tendência principal: Muda de cor dependendo da direção do mercado (verde, vermelho ou laranja).
📏 Canal pontilhado: Reflete a faixa do mercado baseada na volatilidade.
📊 Barras coloridas: Fornecem uma representação visual fácil da fase atual do mercado.
🚀 Por Que Usar Este Sistema?
✔ Identifica rapidamente se o mercado está em tendência ou lateralizado.
✔ Destaca visualmente a força e direção da tendência.
✔ Antecipar reversões potenciais com sinais claros de rompimento e cruzamento.
✔ Confirma pontos de entrada e saída, reduzindo sinais falsos e melhorando a precisão das operações.
🔹 Otimize seu trading e opere com mais confiança usando o Sistema de Rompimento de Canal 🏆. Prepare-se para identificar as melhores oportunidades do mercado! 📈🔥
Indicadores da Ctrader Store:
Dynamic Market Structure
Analysis of Turning Points
Fibonacci Linear
Regression Multi-timeframe
Multi-Level Candle Bias
Tracker
Auto Support and
Resistance Trend Lines
All Support and
Resistance Levels
Resumo
Avaliações de clientes
5 | 33 % | |
4 | 67 % | |
3 | 0 % | |
2 | 0 % | |
1 | 0 % |


