
Descrição
VolumeProfileSuite é um indicador avançado e flexível de Perfil de Volume para cTrader.
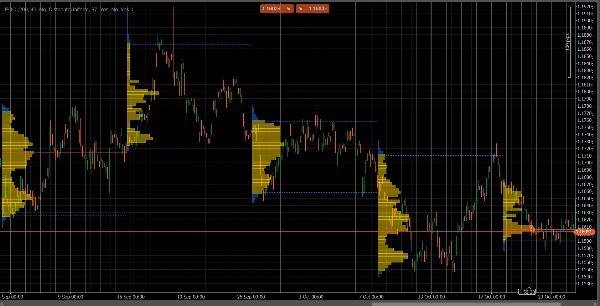
Seu propósito principal é analisar a distribuição de volume (ou seja, onde a atividade de negociação ocorreu) em diferentes níveis de preço para identificar áreas de "valor" (alto volume) e "rejeição" (baixo volume). Isso ajuda você a encontrar os níveis de suporte e resistência mais significativos com base na atividade real do mercado.
Sua característica única é que combina dois modos poderosos de análise em uma única ferramenta, selecionável pelo parâmetro Profile Mode:
FixedRangeMode: Perfeito para análise macro. Permite analisar um único bloco grande de sua escolha (como as últimas 1000 barras ou um intervalo de datas específico, por exemplo, "toda a semana passada"). É ideal para encontrar níveis principais de suporte/resistência de longo prazo.PeriodicMode: Perfeito para análise micro e comportamental. Desenha automaticamente um novo perfil a cada "N" barras (por exemplo, a cada 100 barras). Isso permite ver como o POC e a Área de Valor evoluem ao longo do tempo e estudar os padrões repetitivos do mercado.- Guia de Parâmetros (Inglês)
Aqui está o guia atualizado para seu novo indicador unificado VolumeProfileSuite. Este guia é crucial pois explica quais parâmetros usar (e quais ignorar) com base no modo selecionado.
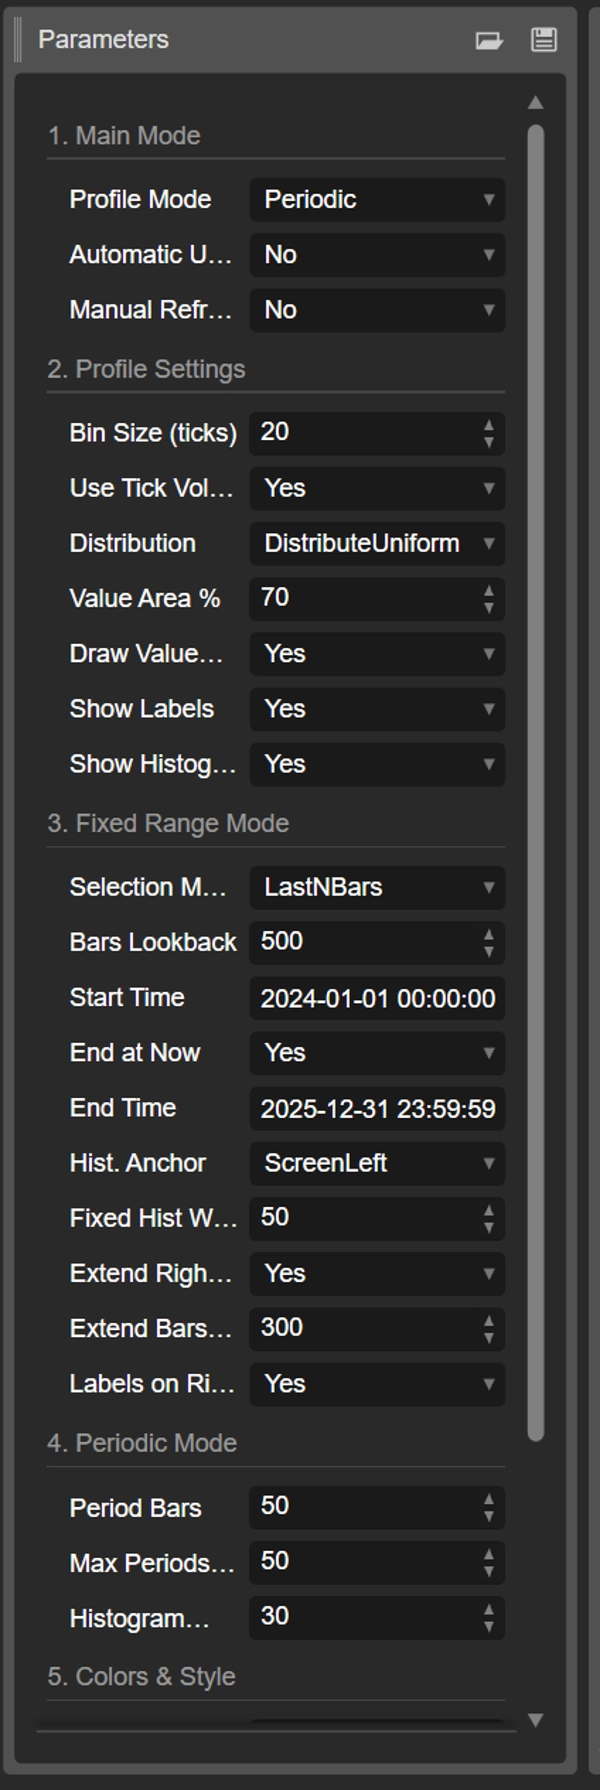
Grupo 1: Modo Principal
- Profile Mode: Este é o parâmetro mais importante e funciona como o interruptor mestre.
-
FixedRange: Ativa o modo "bloco único". O indicador analisará apenas um intervalo especificado por você (usando as configurações do Grupo 3).Periodic: Ativa o modo "cíclico". O indicador automaticamente analisará todo o gráfico em blocos (com base nas configurações do Grupo 4).
IMPORTANTE: Quando estiver no modo
FixedRange, você deve ignorar todos os parâmetros em "Grupo 4: Modo Periódico". Quando estiver no modoPeriodic, você deve ignorar todos os parâmetros em "Grupo 3: Modo de Intervalo Fixo".
Grupo 2: Configurações do Perfil
Estes parâmetros são comuns e aplicam-se a ambos os modos (FixedRange e Periodic).
- Tamanho do Bin (ticks): Controla a "resolução" vertical do perfil. Um valor baixo (por exemplo,
1) cria muitas linhas de preço finas (muito detalhado). Um valor alto (por exemplo,10) agrupa preços em linhas mais grossas (menos detalhado, "mais suave"). - Usar Volume de Tick: Se
true(recomendado), o perfil usa volume real de ticks, que é muito preciso. Sefalse, simplesmente conta "1" para cada barra. - Distribuição: Define como o volume de uma barra é distribuído.
-
DistributeUniform(padrão): "Espalha" o volume da barra por todos os níveis de preço que ela tocou, do seu mínimo ao seu máximo.CloseOnly: Atribui todo o volume da barra apenas ao preço de fechamento.
- % da Área de Valor: Define a porcentagem do volume que constitui a "Área de Valor" (a área de maior atividade de negociação). Um valor de
70(70%) é o padrão do mercado. - Desenhar Área de Valor (VAH/VAL): Se
true, desenha as linhas horizontais para o Valor Alto da Área (VAH) e Valor Baixo da Área (VAL). - Mostrar Rótulos: Se
true, mostra rótulos de texto ("POC", "VAH", "VAL"). (Cuidado: no modoPeriodic, isso pode poluir o gráfico). - Mostrar Histograma: Se
true, desenha o histograma de volume (as barras horizontais).
Grupo 3: Modo de Intervalo Fixo
⚠️ Use estes parâmetros SOMENTE se "Profile Mode" estiver definido como FixedRange.
- Modo de Seleção: Escolhe como definir seu bloco único.
-
DateRange: Usa uma data/hora de início e fim específica.LastNBars: Usa as últimas N barras.
- Barras para Analisar: (Somente para
LastNBars) Quantas barras para analisar para trás (por exemplo,500). - Hora de Início / Terminar Agora / Hora de Término: (Somente para
DateRange) Define o início e o fim do seu intervalo. - Âncora do Histograma: (Somente para
FixedRange) Define onde ancorar o histograma. -
DateRangeStart: No início do seu intervalo (pode estar fora da tela).ScreenLeft: Na borda esquerda da janela visível.ScreenRight: Na borda direita da janela visível (no espaço vazio).
- Largura Fixa do Histograma (barras): A largura do histograma (em barras) para o modo
FixedRange. - Estender Apenas para a Direita: Se
true, as linhas POC/VAH/VAL são estendidas para o futuro. - Estender Barras: (Somente se
Extend Right Onlyfortrue) Quantas barras estender as linhas. - Rótulos à Direita: Se
true, coloca rótulos de preço na extremidade direita das linhas estendidas.
Grupo 4: Modo Periódico
⚠️ Use estes parâmetros SOMENTE se "Profile Mode" estiver definido como Periodic.
- Barras por Período: Este é o parâmetro chave para este modo. Define quantas barras incluir em cada bloco cíclico (por exemplo,
100). - Máximo de Períodos para Desenhar: 🌟 PARÂMETRO DE SEGURANÇA! Isso limita o número de perfis cíclicos desenhados para evitar que o cTrader trave.
50significa que ele desenhará apenas os 50 perfis mais recentes, mesmo que o histórico tenha mais. Não defina isso muito alto (por exemplo, > 200) ou o cTrader pode congelar! - Largura do Histograma (barras): A largura do histograma (em barras) para cada bloco cíclico.
Grupo 5: Cores e Estilo
Estes parâmetros são comuns e aplicam-se a ambos os modos.
- Cor do POC: A cor da linha do Ponto de Controle.
- Cor do VA: A cor das linhas VAH e VAL.
- Espessura da Linha: A espessura das linhas POC, VAH e VAL.
- Cor do Histograma VA: A cor das barras do histograma dentro da Área de Valor (padrão: Amarelo).
- Cor do Histograma Fora: A cor das barras do histograma fora da Área de Valor (padrão: Azul).
- Opacidade do Histograma %: A transparência (opacidade) de todo o histograma.
Resumo
The indicator offers two main analysis modes selectable via the Profile Mode parameter:
1. FixedRange Mode: Analyzes a single user-defined interval, such as a specific date range or the last N bars, suitable for macro-level, long-term support and resistance identification.
2. Periodic Mode: Automatically segments the chart into consecutive blocks of N bars, drawing a new profile for each. This mode supports micro-level and behavioral analysis by tracking how the Point of Control (POC) and Value Area evolve over time.
Common configurable settings include bin size (price resolution), volume type (tick volume or bar count), volume distribution method, value area percentage, and visual options such as histogram display and labeling. FixedRange and Periodic modes have distinct parameter groups to tailor their respective analyses.
Color and style options allow customization of POC, Value Area lines, and histogram appearance. The tool supports various markets including Forex, indices, commodities, stocks, and cryptocurrencies, as indicated by its relevant tags.
Avaliações de clientes
5 | 50 % | |
4 | 50 % | |
3 | 0 % | |
2 | 0 % | |
1 | 0 % |


![Logótipo de "High-Low Divergence [Iridio Capital]"](https://cdn.ctrader.com/image/webp/443c4661-7abb-40f1-842f-4b6ec560649b_40914)


