Descrição
Este não é o seu típico Indicador de Delta de Volume. Este é o Indicador de Delta de Volume Level 2 DOM — Fluxo de Ordens de Grau Institucional para cTrader. A Vantagem pela qual as Instituições Pagam Milhões.
O Problema que Todo Trader de Varejo Enfrenta. Uma vela fecha verde. O volume está alto. Você compra.
O preço reverte instantaneamente. Você é estopado. O gráfico "mentiu" para você.
Ele não mentiu — você apenas não conseguia ver o que estava acontecendo dentro da vela. Aquela barra verde com volume alto? 70% desse volume foi venda agressiva. O fechamento foi sustentado por uma camada fina de ordens de compra na parte inferior da faixa. Instituições estavam distribuindo para sua ordem de compra.
Indicadores de volume padrão mostram o total. Eles nunca mostram quem estava no controle.
O Delta de Volume muda isso. O que o Delta de Volume Realmente Mostra
O Delta de Volume separa o volume de cada barra em volume de compra e volume de venda, depois calcula a diferença — o delta. Um delta positivo significa que os compradores foram mais agressivos. Um delta negativo significa que os vendedores dominaram.
Esta é a informação mais importante que separa traders profissionais de traders de varejo: não quanto foi negociado, mas qual lado estava negociando com mais agressividade. Isso é convicção. O delta é a impressão digital da intenção por trás de cada barra de preço.
Mas não para por aí
Este indicador não faz suposições. Em uma mistura proprietária de dados, ele lê dados de Profundidade de Mercado Level 2 — o livro de ordens real por trás do preço que você vê na tela.
Os dados Level 2 (também conhecidos como DOM — Depth of Market) mostram as ordens reais de compra e venda empilhadas em cada nível de preço. Não a última negociação. Não uma estimativa. A liquidez real em espera de bancos, fundos de hedge e mesas institucionais fluindo através dos provedores de liquidez do seu corretor.
O resultado é um nível de precisão de 85-95% na classificação de volume de compra versus venda — muito além do que qualquer aproximação baseada em fórmulas pode alcançar.
Por Que Isso Importa — O Que as Instituições Veem Que Você Não Vê
Goldman Sachs, Citadel, Jump Trading — todos negociam com dados de fluxo de ordens. Eles veem a pressão de compra e venda em tempo real. Eles veem absorção. Eles veem quando um nível está sendo defendido. Eles veem quando o delta diverge do preço.
Eles pagam milhões por essa infraestrutura. Os feeds de dados, os servidores co-localizados, as ferramentas proprietárias.
Este indicador traz o mesmo conceito central para seu gráfico cTrader. Não uma versão diluída. Os dados reais Level 2 DOM do pool de liquidez do seu corretor, processados na mesma classificação de compra versus venda que traders profissionais de fluxo de ordens usam.
A diferença entre um trader de varejo e um trader institucional não é inteligência. É informação. O Delta de Volume fecha essa lacuna.
Para Quem Isso É
Day traders que querem ver através do ruído. Quando uma vela parece otimista mas o delta é negativo, você sabe que deve esperar. Quando uma vela parece fraca mas o delta é fortemente positivo, você sabe que as instituições estão acumulando. O delta não mente — ele mostra o que aconteceu, não como parecia.
Scalpers que precisam saber qual lado está no controle agora mesmo. Um pico no delta em um rompimento confirma que é real. Um rompimento com delta plano te diz que é uma armadilha antes mesmo da reversão começar.
Swing traders que querem confluência. Divergências de delta — onde o preço faz uma nova mínima mas o delta está subindo — são alguns dos sinais de reversão mais confiáveis no trading profissional. Este indicador as detecta automaticamente.
Qualquer pessoa negociando forex, índices ou commodities no cTrader com um corretor que fornece dados Level 2. Fusion Markets, IC Markets, Go Markets e corretores ECN/STP similares fornecem todos os dados DOM que este indicador lê.
Se você já esteve do lado errado de uma vela de "alto volume", esta é a ferramenta que te diz o porquê.
O Que Você Recebe
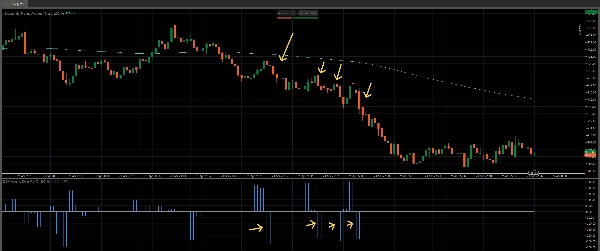
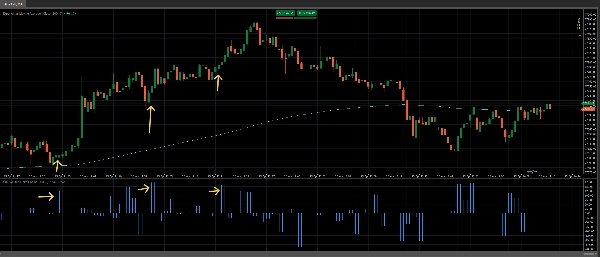
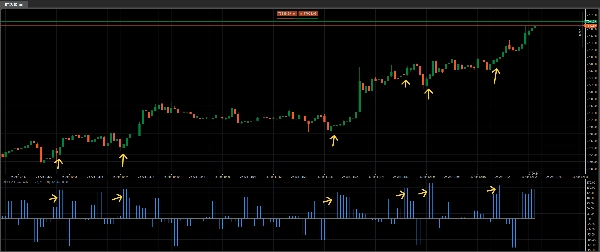
Um histograma limpo e profissional abaixo do seu gráfico mostrando o delta líquido para cada barra, baseado em dados altamente precisos. Barras positivas significam que os compradores dominaram. Barras negativas significam que os vendedores dominaram. O tamanho da barra mostra quanto um lado superou o outro. Usado junto com indicadores como a média móvel exponencial 200 dá confluência e setups de alta probabilidade.
Sem bagunça. Sem médias móveis de volume atrasadas. Sem velas coloridas que "estimam" compra e venda. Apenas a diferença bruta e não filtrada entre compra agressiva e venda agressiva — calculada a partir da fonte de dados mais profunda disponível para traders de varejo.
Este indicador também oferece a opção de usar um filtro de volume para mostrar apenas as barras que mais importam. Agregar barras de volume se desejar.
Um olhar para a barra delta te diz o que dez outros indicadores tentam aproximar. Adquira o seu agora para cTrader. É uma escolha óbvia por esse preço baixo.
Combine isso com nosso indicador Volume Profile Pro para decisões ainda mais informadas em níveis-chave: https://ctrader.com/products/4079
Veja nosso incrível Black Box Bot aqui: https://ctrader.com/products/3241
Resumo
The indicator displays a clean histogram below the chart representing net volume delta per bar: positive bars indicate buyer dominance, negative bars indicate seller dominance, and bar size reflects the strength of that dominance. This provides traders with insight into market intent beyond total volume, revealing whether buyers or sellers controlled the price action.
It supports forex, indices, and commodities trading with brokers offering Level 2 data, such as Fusion Markets and IC Markets. Features include volume filtering and aggregated volume bars. The tool is suited for day traders, scalpers, and swing traders seeking to interpret order flow, confirm breakouts, detect divergences, and enhance decision-making with professional-level order flow data.
Avaliações de clientes
5 | 50 % | |
4 | 50 % | |
3 | 0 % | |
2 | 0 % | |
1 | 0 % |