
Descrição
Nota: Testado apenas no cTrader para Windows.
LT_Ind_Pivot é um indicador poderoso e personalizável de Pontos de Pivô para cTrader que ajuda a visualizar níveis-chave do mercado e estruturas de sessão em múltiplos períodos de tempo.
Ele calcula e plota automaticamente Pivô (P), Suporte (S1–S5), Resistência (R1–R5), e CPR (TC/BC) com base no seu período âncora escolhido — de H1, H4, H8, H12, D1, W1, até Mês1.
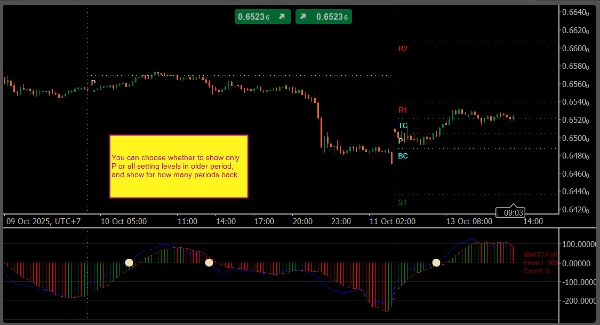
O indicador também desenha linhas separadoras verticais para cada período âncora, tanto no gráfico principal quanto nos painéis de indicador, facilitando a distinção dos limites de sessões ou períodos.
Você pode definir exatamente quais níveis mostrar usando notações flexíveis como:
P, S1, R1– níveis padrãoPS1,S1S2,R1R2, etc. – níveis intermediários entre pivôs e suportes/resistências principaisTC,BC– Faixa Central de Pivô (CPR)
Os controles de exibição permitem definir quantos pivôs históricos manter visíveis, se mostram rótulos de texto/preço, e como colorir ou estilizar cada nível.
Principais Recursos
- Âncoras de pivô: H1, H4, H8, H12, D1, W1, Mês1
- Sintaxe personalizada de níveis:
P, Sx, Rx, PS1, S1S2, R1R2, TC, BC - Separadores verticais de período no gráfico e painéis de indicador
- Opção para mostrar texto, preços e níveis antigos de pivô
- Personalização completa de cores e estilos de linha
- Leve e adequado para negociação ao vivo
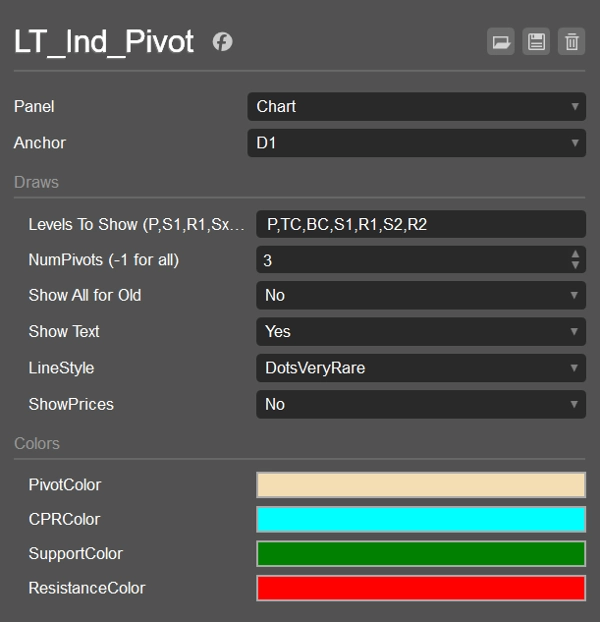
Configurações Padrão
- Âncora: D1
- Mostrar Níveis:
P,S1,R1 - NumPivotsBack: 1
- ShowAllForOldPivots: false
- Mostrar Texto: true
- Mostrar Preços: false
- Estilo de Linha: Sólido
- Cores: Pivô = Trigo, CPR = Ciano, Suporte = Verde, Resistência = Vermelho
Casos de Uso
- Marcar zonas de suporte/resistência intradiárias e swing
- Acompanhar CPR e níveis intermediários para configurações de rompimento ou reversão à média
- Usar separadores de período para analisar a estrutura sessão a sessão
- Combinar com indicadores VWAP ou Swing para maior confluência
Resumo
Avaliações de clientes
5 | 0 % | |
4 | 100 % | |
3 | 0 % | |
2 | 0 % | |
1 | 0 % |


