
Descrição
Nota: Testado apenas no cTrader Windows.
Perfil de Volume
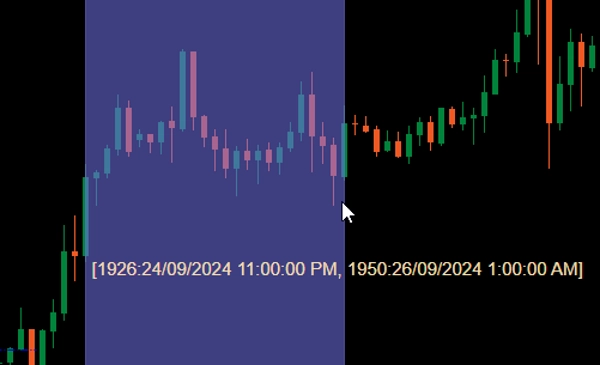
Um desenho de perfil vertical no gráfico de preços para mostrar em qual preço há mais/menos volume (interesse de negociação).
O indicador Flexible Volume Profile
Quando adicionado ao seu gráfico, arraste com o botão esquerdo do mouse enquanto pressiona Ctrl em uma área do gráfico de preços para desenhar o perfil para essa área.
Para fins de desempenho, o perfil será desenhado em 2 estados:
- Perfil grosseiro: O indicador usará o timeframe definido por CoarseTF (padrão m5) para carregar as informações de volume, isso geralmente é rápido. Enquanto o perfil grosseiro é mostrado, o perfil fino será carregado em segundo plano.
- Perfil fino: Perfil mais preciso, que usa o timeframe definido por FineTF (padrão m1), mas você pode configurá-lo para o mais fino (t1 - único tick). No entanto, se você estiver visualizando um gráfico diário ou de timeframe maior, configurar para timeframe de ticks aumentará o tempo de carregamento.
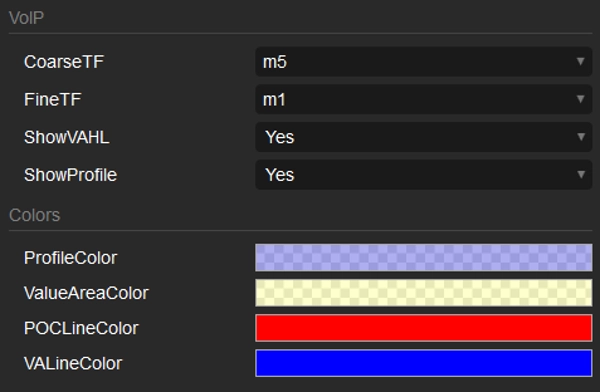
Parâmetros
- CoarseTF: Timeframe para dados grosseiros (padrão m5).
- FineTF: Timeframe para dados finos (padrão m1).
- ShowVAHL: Mostra o VAH (Valor Alto da Área) e VAL (Valor Baixo da Área).
- ShowProfile: Se sim, mostra o perfil completo, caso contrário, mostra apenas VAH, VAL e POC (Ponto de Controle).
- Colors: Personalização de cores.
Como usar
Após adicionar o indicador ao seu gráfico de preços, use um arrasto com o botão esquerdo do mouse enquanto pressiona Ctrl para selecionar a região no gráfico que você gostaria de perfilar e pronto.
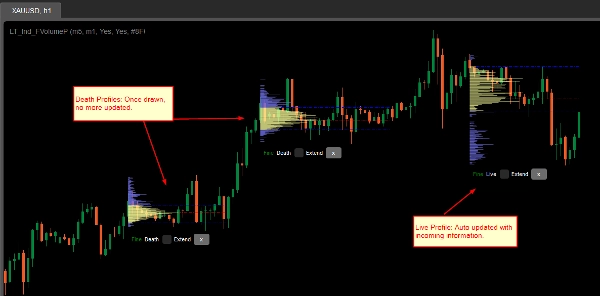
Após o perfil ser renderizado, você verá algumas informações/manipulações na parte inferior do perfil:
- Grosseiro/Fino: status do perfil.
- Morto/Vivo: se seu perfil cobre a última barra (vela), então é um perfil Vivo e atualizado automaticamente com as informações que chegam.
- Caixa de seleção Extend: marque para estender as linhas VAH, VAL e POC até a última barra (vela)
- Botão x: Clique para remover o perfil do gráfico.
Resumo
Users activate the profile by holding Ctrl and dragging the mouse over a desired chart region. The indicator operates in two modes for performance optimization: a Coarse profile using a configurable timeframe (default 5 minutes) for faster loading, and a Fine profile using a finer timeframe (default 1 minute, with an option down to single ticks) for more precise volume data.
Key parameters include:
- CoarseTF and FineTF: timeframes for coarse and fine volume data aggregation.
- ShowVAHL: toggles display of Value Area High (VAH) and Value Area Low (VAL).
- ShowProfile: controls whether the full profile or only key levels (VAH, VAL, Point of Control) are shown.
- Colors: customizable color settings.
After rendering, the profile provides status indicators (Coarse/Fine, Live/Dead), options to extend VAH, VAL, and POC lines to the latest bar, and the ability to remove the profile. This tool supports detailed volume analysis to assist traders in identifying significant price levels based on traded volume.
Avaliações de clientes
5 | 100 % | |
4 | 0 % | |
3 | 0 % | |
2 | 0 % | |
1 | 0 % |


