


Descrição
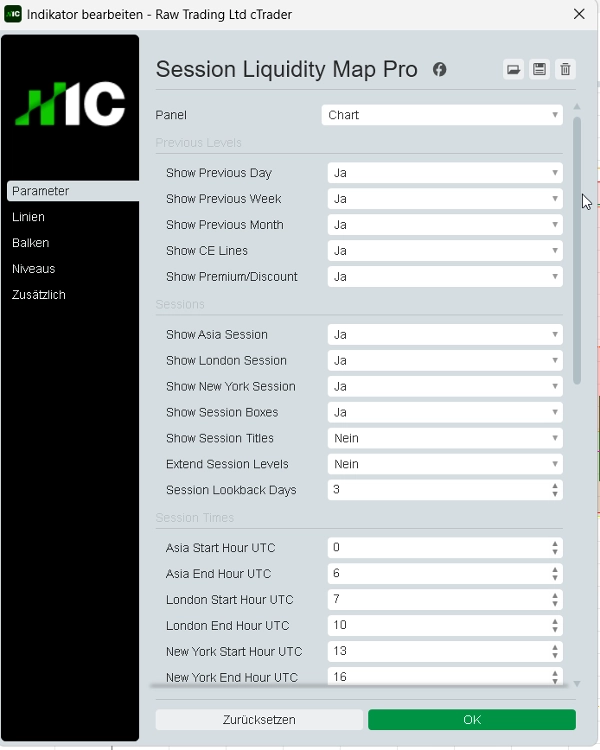
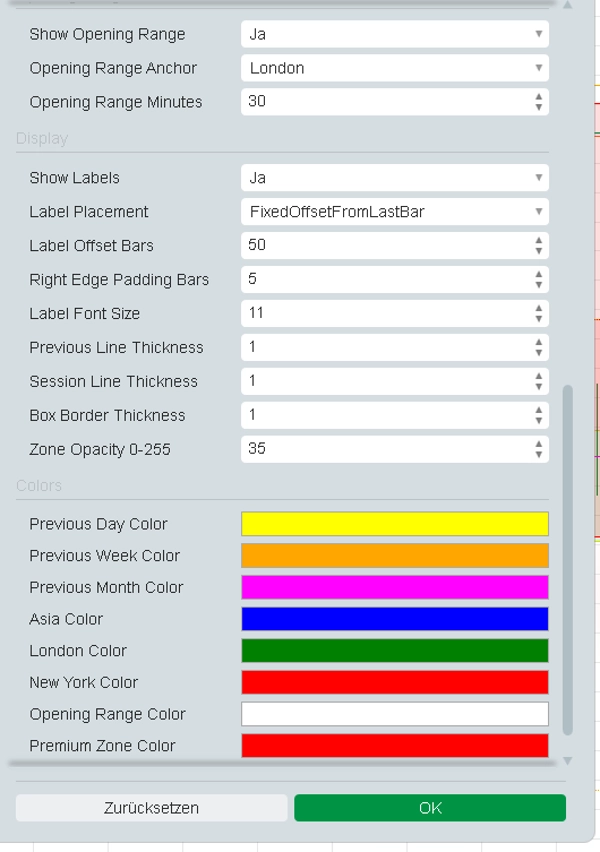
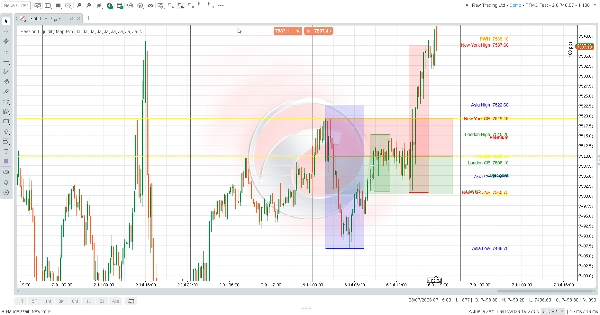
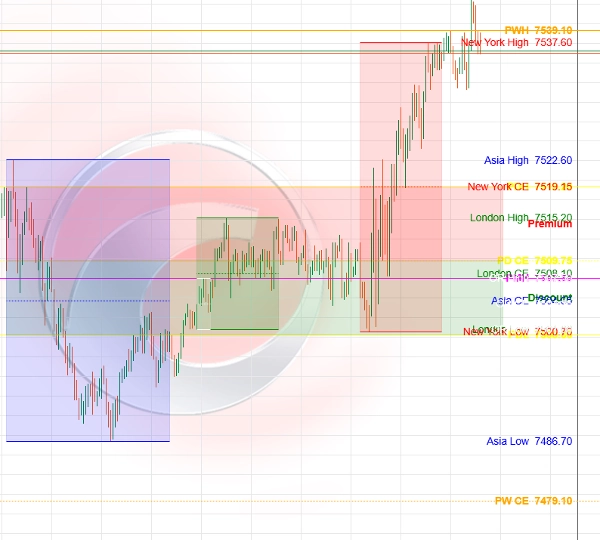
Session Liquidity Map Pro é um indicador visual do cTrader para análise estruturada da ação do preço. Ele exibe automaticamente as máximas/mínimas do dia, semana e mês anteriores com níveis de equilíbrio, intervalos das sessões Ásia/Londres/Nova York, níveis do intervalo de abertura e zonas de prêmio/desconto.
O indicador é projetado para preparação de gráficos, análise baseada em liquidez, revisão da estrutura do mercado e pesquisa de backtesting. Ele não executa negociações, não fornece sinais de compra/venda e não requer Acesso Total.
Negociar envolve riscos. Desempenho passado não garante resultados futuros.
Resumo
AI summary
Session Liquidity Map Pro is a visual indicator for the cTrader platform designed to enhance structured price action analysis. It automatically maps key market data on your chart, including previous day, week, and month highs and lows, equilibrium levels, and session ranges for Asia, London, and New York. The indicator also highlights opening range levels and premium/discount zones, aiding in liquidity-based analysis and market structure review.
This tool supports chart preparation and backtesting research by visually presenting critical price levels and zones relevant to market participants. It does not execute trades or provide buy/sell signals and operates without requiring full access permissions. The indicator is categorized under market structure and provides visual outputs to assist traders in identifying liquidity sweeps, market structure shifts, key levels, and premium/discount areas.
Session Liquidity Map Pro is suitable for traders focusing on market structure concepts and price action analysis, offering a comprehensive overview of session dynamics and historical price points to inform trading decisions.
This tool supports chart preparation and backtesting research by visually presenting critical price levels and zones relevant to market participants. It does not execute trades or provide buy/sell signals and operates without requiring full access permissions. The indicator is categorized under market structure and provides visual outputs to assist traders in identifying liquidity sweeps, market structure shifts, key levels, and premium/discount areas.
Session Liquidity Map Pro is suitable for traders focusing on market structure concepts and price action analysis, offering a comprehensive overview of session dynamics and historical price points to inform trading decisions.
Perfil do indicador
Categoria do indicador
Estrutura do mercado (SMC)
Tipo de resultado
Visualização
Requisitos de dados
Apenas barras
Sinais suportados
Inversão
Quebra
Força da tendência
Toque no nível
Quebra de nível
Intervalo na abertura da sessão
Avaliações de clientes
0.0
Avaliações: 0
Avaliações de clientes
Ainda não há avaliações para este produto. Já o experimentou? Seja o primeiro a contar a outras pessoas!
Conversa
Perguntas frequentes
Premium/Discount
Supertrend
Key Levels
MSS
Liquidity Sweep
Market Structure
Os produtos disponíveis através da cTrader Store, incluindo bots de negociação, indicadores e plugins, são fornecidos por programadores terceiros e são disponibilizados apenas para fins informativos e de acesso técnico. A cTrader Store não é um corretor e não fornece aconselhamento em matéria de investimento, recomendações pessoais ou qualquer garantia de desempenho no futuro.
Mais deste autor


























Preço
4
Vendas