
Dem
Indicador
2 compras
Versão 2.0, Apr 2026
Windows, Mac
4.2
Avaliações: 4

Descrição
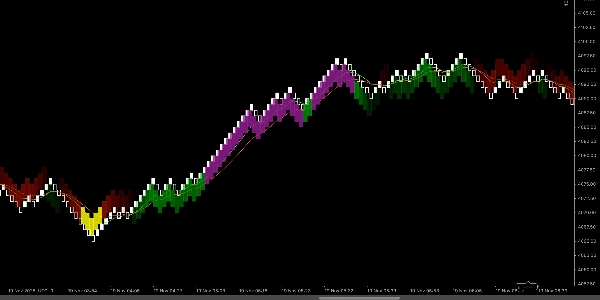
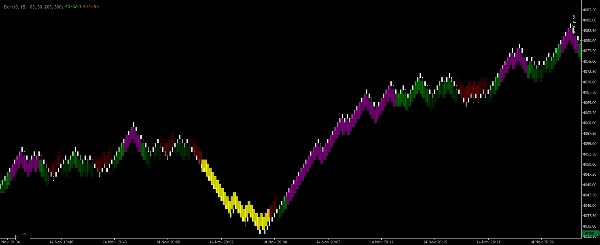
Renko EMA-Scalper Zones é um indicador visual leve para scalping construído exclusivamente para gráficos Renko de 100 pips na plataforma cTrader. Ele usa duas Médias Móveis Exponenciais (EMAs) para identificar a direção da tendência de curto prazo e destacar zonas limpas e negociáveis. O indicador desenha retângulos preenchidos no gráfico em quatro cores para que os scalpers possam ler imediatamente o viés do mercado e identificar entradas de maior probabilidade sem cálculos manuais.
O que cada cor significa
- Retângulo verde — Tendência de alta confirmada. A EMA rápida está acima da EMA lenta e as EMAs estão orientadas para cima. Use para operações longas curtas seguindo a tendência.
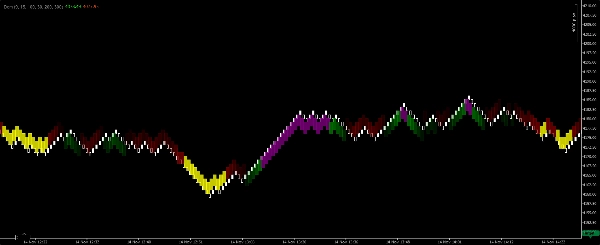
- Retângulo roxo — Zona de entrada de compra dentro de um contexto de alta. Indica um recuo ou consolidação de curto prazo dentro de uma tendência de alta ativa que pode oferecer uma oportunidade de scalping.
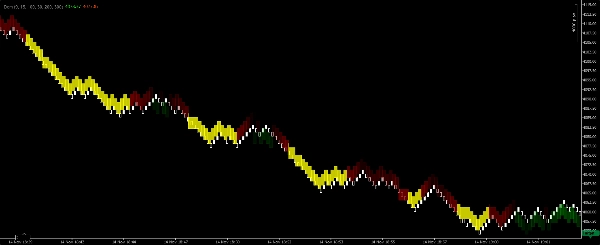
- Retângulo vermelho — Tendência de baixa confirmada. A EMA rápida está abaixo da EMA lenta e as EMAs estão orientadas para baixo. Use para operações curtas curtas seguindo a tendência.
- Retângulo amarelo — Zona de entrada de venda dentro de um contexto de baixa. Indica um recuo ou consolidação de curto prazo dentro de uma tendência de baixa ativa que pode oferecer uma oportunidade de scalping.
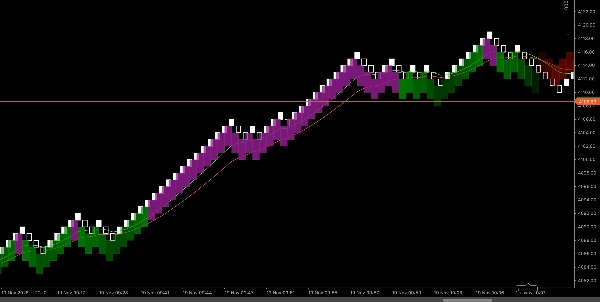
Como funciona (resumo da lógica)
- O indicador calcula duas EMAs (Rápida e Lenta) em um gráfico Renko de 100 pips e avalia seu alinhamento relativo e inclinação para determinar a direção da tendência.
- Quando as EMAs indicam um alinhamento claro de alta e momentum, o indicador desenha um retângulo verde que abrange a região da tendência. Se uma consolidação curta ou recuo aparecer dentro dessa região de alta, o indicador desenha um retângulo roxo para marcar uma oportunidade de entrada de compra.
- A mesma lógica se aplica inversamente para condições de baixa, produzindo retângulos vermelhos (tendência) e amarelos (entrada).
- Os retângulos são desenhados como zonas (não barras únicas) para que os scalpers possam avaliar visualmente onde cronometrar entradas e saídas rápidas.
Configurações recomendadas (padrões para scalper)
- Tipo de gráfico: Renko
- Tamanho do tijolo Renko: 100 pips (indicador projetado para esse tamanho de tijolo).
- Sensibilidade / detecção — um parâmetro ajustável controla quão estritamente o indicador requer o alinhamento das EMAs antes de desenhar os retângulos de tendência (menor = mais sinais; maior = menos sinais, porém mais fortes).
- Opacidade do retângulo — ajuste para clareza visual sobre as barras de preço.
- Filtro de sessão — recomendado restringir às horas de alta liquidez para scalping.
- Largura máxima da zona (barras) — limite opcional para evitar zonas esticadas demais.
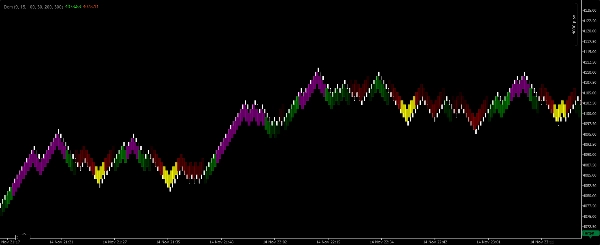
Orientações de uso e regras para scalpers
- Trate os retângulos verde/vermelho como confirmação de tendência. Prefira operar na direção da zona de tendência colorida e evite scalps agressivos contra a tendência quando um retângulo de tendência dominar.
- Use os retângulos roxo/amarelo como janelas de entrada para scalping dentro da tendência confirmada — procure um gatilho rápido de microestrutura (por exemplo, barra de momentum, rompimento de uma pequena consolidação) antes de entrar.
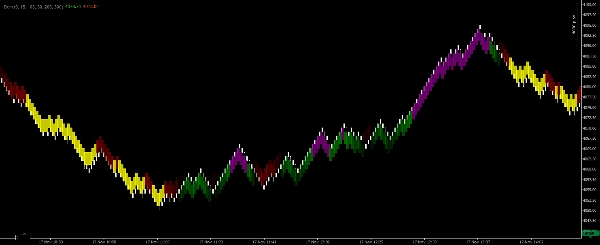
- Os alvos devem ser apertados e realistas para scalping (múltiplos pequenos do seu stop). Use alvos fixos em pips ou confirmações por número mínimo de barras dependendo do seu perfil de risco.
- Coloque stops além da mínima/máxima recente da microestrutura ou fora da zona de entrada; scalping requer perdas pequenas e disciplina.
- Combine com confirmação de volume/ação de preço (se disponível) e opere apenas durante sessões ativas.
- Faça backtest visual nos seus instrumentos — Renko de 100 pips favorece pares voláteis e instrumentos onde tijolos de 100 pips produzem estrutura de preço útil para scalping.
Resumo
Perfil do indicador
Avaliações de clientes
4.2
Avaliações: 4
5 | 50 % | |
4 | 25 % | |
3 | 25 % | |
2 | 0 % | |
1 | 0 % |
Avaliações de clientes
November 25, 2025
A decent setup here should survive 50 quick trades without looking messy. A few sessions of data make the result easier to trust. The useful comparison is hit rate versus average R.
November 18, 2025
The product feels more useful when the plan is already written down. A 13 setup run on daily close keeps the review grounded.
November 18, 2025
This feels useful when you already has a plan. The main value is short term execution, not chasing every signal that appears. Early sizing should stay modest until the journal looks stable.
November 18, 2025
Useful tool, but not for lazy entries. It supports short term execution and feels more useful if the trader stays selective.
Conversa
Perguntas frequentes
BTCUSD
Forex
Signal
Scalping
Commodities
Crypto
XAUUSD
Os produtos disponíveis através da cTrader Store, incluindo bots de negociação, indicadores e plugins, são fornecidos por programadores terceiros e são disponibilizados apenas para fins informativos e de acesso técnico. A cTrader Store não é um corretor e não fornece aconselhamento em matéria de investimento, recomendações pessoais ou qualquer garantia de desempenho no futuro.
Mais deste autor


![Logótipo de "High-Low Divergence [Iridio Capital]"](https://cdn.ctrader.com/image/webp/443c4661-7abb-40f1-842f-4b6ec560649b_40914)


Preço
Desde 14/03/2025
23
Vendas