
Multi EMA Timeframes
指标
1 购买
版本 1.0, Apr 2026
Windows 版、Mac 版
4.5
评价:2
说明
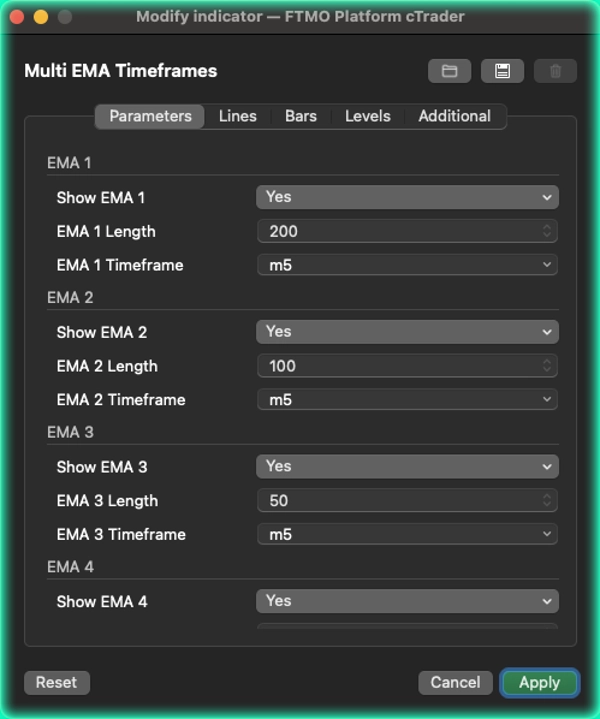
多时间框架EMA指标,由 [BeyondTrading] 提供 交易者在使用移动平均线时最常犯的错误是切换时间框架来查看关键EMA的位置。多时间框架EMA指标完全消除了这一问题。您可以停留在当前的工作时间框架——5分钟、15分钟、1小时——并且可以精确定义来自哪个时间框架的哪个EMA应立即显示在您的图表上,无需切换任何页面。
您在5分钟图表上,想要查看小时线的200 EMA?完成。您还想同时查看15分钟的50 EMA和当前时间框架的20 EMA?也可以。五个EMA中的每一个都可以完全独立配置:各自的周期、各自的源时间框架、各自的颜色以及各自的开关。
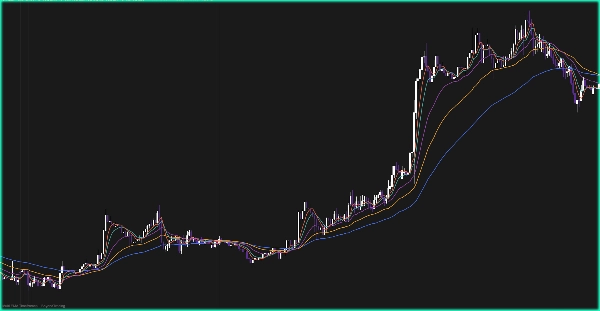
这对于多重确认设置尤其强大。当您入场时间框架上的价格接近属于更高时间框架的EMA时,该水平具有真正的结构性重要性。直接在图表上看到它——无需切换标签页,无需反复确认精确数值——会改变您与这些关键区域的互动方式。
两种渲染模式让您控制线条的绘制方式。阶梯模式将每个EMA锁定在最后一个完全关闭的源K线上,因此数值在更高时间框架的K线收盘前不会变化——零重绘,完全可靠,适合实时交易决策。平滑模式则在源K线之间连续插值,视觉更为流畅,更适合分析和复盘。
它的不同之处 大多数多EMA指标都是在当前图表时间框架上计算所有内容。而这里,每个EMA都真正来自其独立的时间框架。您不是在做近似计算——您读取的是该时间框架交易者实际看到的真实EMA。
功能特点
- 最多支持5个完全独立的EMA,每个拥有自己的时间框架和周期
- 在任何图表时间框架上停留,同时读取来自任何其他时间框架的EMA
- 阶梯模式:数值锁定于已关闭的源K线,无重绘
- 平滑模式:线性插值,实现流畅的视觉过渡
- 每个EMA的显示/隐藏开关,始终保持图表整洁
摘要
指标配置
客户评价
4.5
评价:2
5 | 50 % | |
4 | 50 % | |
3 | 0 % | |
2 | 0 % | |
1 | 0 % |
客户评价
April 29, 2026
Two timeframes give more context. One quick look should not become the whole decision.
April 15, 2026
Signal count matters more than one nice example, and the trade idea gets a pause before execution.
讨论
常见问答
EMA
AI-assisted
Moving Average
cTrader Store 提供的所有产品,包括交易机器人、指标和插件,均由第三方开发者提供,仅供信息参考和技术访问之用。cTrader Store 并非经纪商,不提供投资建议、个人推荐或任何未来业绩保证。
该作者的其他作品


猜您喜欢


价格
注册日期 21/01/2026
3
销售
176
免费安装