
说明
交易时段套件 — 由 [BeyondTrading]
大多数交易者关注价格。最优秀的交易者关注 价格相对于产生它的时段的位置。交易时段套件立即为您提供该上下文 — 无需切换工具,无需心算,无需盯着时钟。
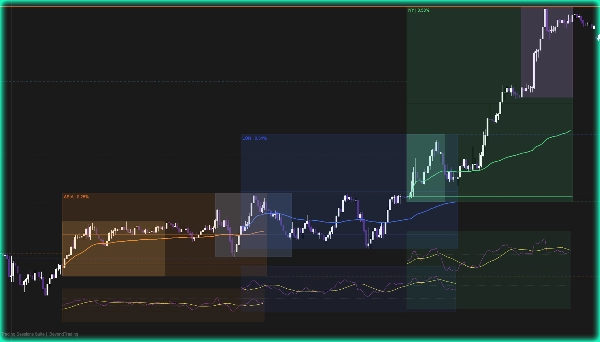
时段一开盘,其框体开始构建。您可以实时看到区间的形成,时段开盘标记为参考水平,随着新高和新低的出现,均衡中线不断更新,并且有一个锚定于该时段首根K线的VWAP。当时段收盘时,高点和低点作为虚线水平延伸至下一时段 — 这样您可以立即知道新的价格行为是在接受还是拒绝之前的区间。
杀戮区直接叠加在每个时段组内:亚洲开盘、伦敦开盘、纽约开盘和纽约收盘。这些是机构订单流历来最活跃的窗口。在它们所属的时段内看到它们的上下文,会改变您解读其周围市场结构的方式。
当时段收盘时,一个迷你RSI面板会自动出现在其下方。振荡器和信号线,按时段区间比例绘制。这是一个快速判断时段是趋势清晰、盘整还是反转的读数 — 无需打开单独的指标窗口。
为什么它胜过所有其他时段指标
大多数时段工具仅停留在绘制彩色框。它们告诉您 何时发生了时段。它们对时段内发生的 内容一无所知。交易时段套件将每个时段视为完整的分析单元:其自身的区间、平均价格、动量上下文和流动性窗口 — 全部在单一叠加层,无需额外面板。
其他指标让您选择:时段框 或 VWAP 或杀戮区。而这里,一切都层叠在一起并逻辑分组 — 亚洲设置与亚洲杀戮区同处,伦敦设置与伦敦杀戮区同处,纽约设置包含其开盘和收盘杀戮区。您配置的是市场,而非一堆断开的参数。
区间延伸线更上一层楼。当时段收盘时,其高点和低点向前投射,并在下一时段开盘时自动终止。无需手动清理,无陈旧线条杂乱图表 — 只有干净、动态的水平,准确反映新时段已收复或仍尊重前一时段区间的程度。
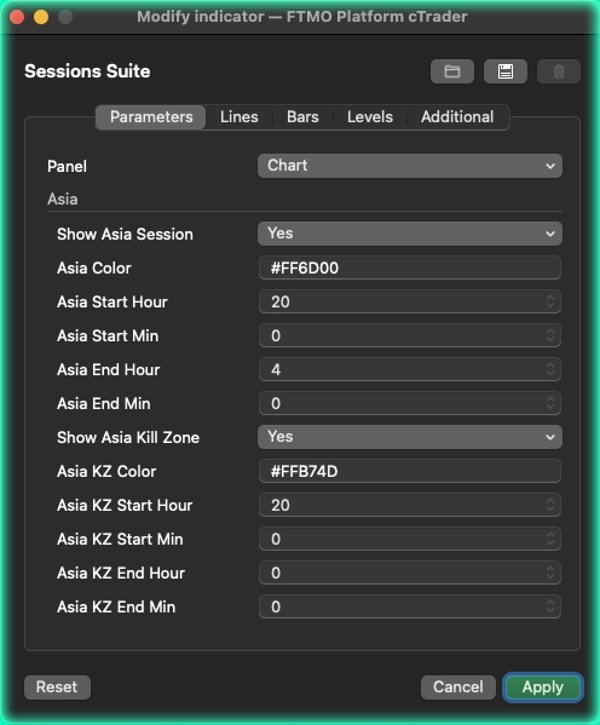
每个时段完全独立。颜色、时间和杀戮区在干净的分组参数面板中按时段配置。时区是单一下拉菜单 — 无需字符串格式化。
您将获得:
实时时段框,包含高点、低点、开盘水平、中线和VWAP — 时段区间延伸至下一时段,开盘时自动终止 — 四个杀戮区与其时段分组 — 时段收盘时迷你RSI + 信号面板 — 完整的每时段颜色和时间自定义 — 包含所有主要市场的时区下拉菜单
摘要
客户评价
5 | 50 % | |
4 | 50 % | |
3 | 0 % | |
2 | 0 % | |
1 | 0 % |


!["Smart Money Concepts (SMC) [Iridio Capital]" 标识](https://cdn.ctrader.com/image/webp/28b69fd1-ef54-4bed-9487-07e78e883be4_40934)


