
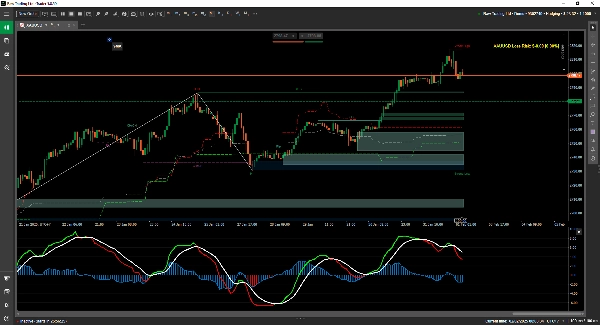
SmartBot-Volume MACD
指标
5 购买
版本 1.0, Feb 2025
Windows 版、Mac 版
4.3
评价:3
说明
🚀 介绍 Volume MACD – 终极趋势与动量指标! 🚀
通过 Volume MACD,一款将 成交量整合进 MACD 的革命性指标,提升您的交易水平,提供 更强的确认、更高的准确性和更深的市场洞察。这是识别强劲趋势和动量变化的 完美组合!
🔥 为什么选择 Volume MACD? 🔥
✅ 增强的精准度: 结合了 趋势强度和成交量确认。
✅ 更强的信号: 过滤掉弱势波动, 识别高概率交易机会。
✅ 适用于任何市场: 适用于 股票、外汇、加密货币等。
用 Volume MACD 升级您的策略,开始以 信心和精准度 交易! 📊🚀
摘要
AI 摘要
Volume MACD is a technical indicator that integrates volume data into the traditional MACD (Moving Average Convergence Divergence) to enhance trend and momentum analysis. By combining trend strength with volume confirmation, it aims to provide stronger signal confirmations, improved accuracy, and deeper market insights. This integration helps filter out weak price movements and identify high-probability trading setups. Volume MACD is designed for use across various markets, including stocks, forex, and cryptocurrencies, making it a versatile tool for traders seeking to identify powerful trends and momentum shifts.
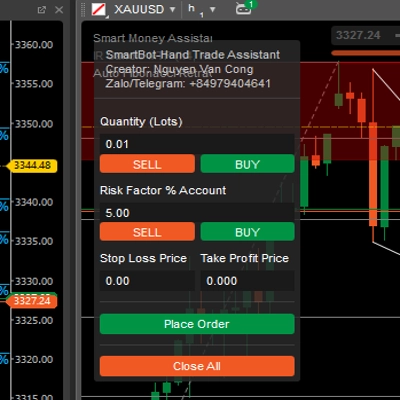
指标配置
客户评价
4.3
评价:3
5 | 33 % | |
4 | 67 % | |
3 | 0 % | |
2 | 0 % | |
1 | 0 % |
客户评价
February 4, 2025
Realistic chart layer if the trader wants it adds useful information behind the price move. It works best as support, not a final decision maker. Volume context is stronger when POC, VWAP and value area agree across 2 sessions. volume alone can be noisy without price action.
February 3, 2025
February 3, 2025
Balanced execution aid for traders who want confirmation beyond candles. It gives value around volume based context, but volume alone can be noisy without price action. I would review 20 reactions near POC or VWAP before trusting the read. The data helps most when price action confirms the same zone.
讨论
常见问答
Forex
Crypto
Stocks
MACD
cTrader Store 提供的所有产品,包括交易机器人、指标和插件,均由第三方开发者提供,仅供信息参考和技术访问之用。cTrader Store 并非经纪商,不提供投资建议、个人推荐或任何未来业绩保证。
该作者的其他作品


价格
注册日期 29/11/2024
32
销售
1.01K
免费安装