
Smart Support Resistance Break Detector
指标
140 下载
版本 1.0, Apr 2026
Windows 版、Mac 版
注册日期 21/01/2026
6
销售
254
免费安装
说明
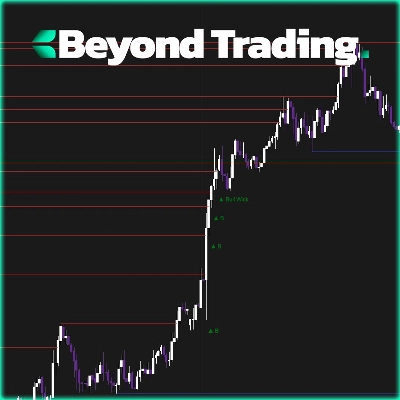
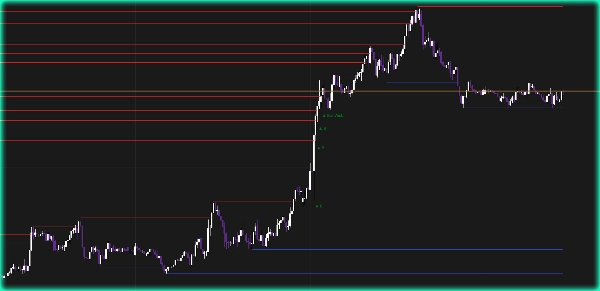
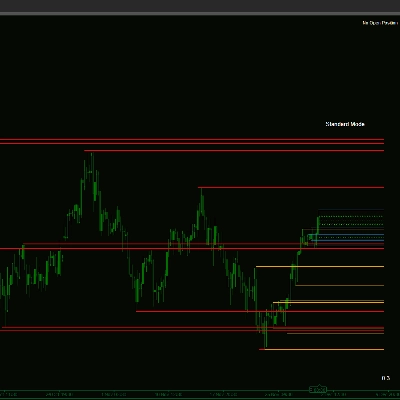
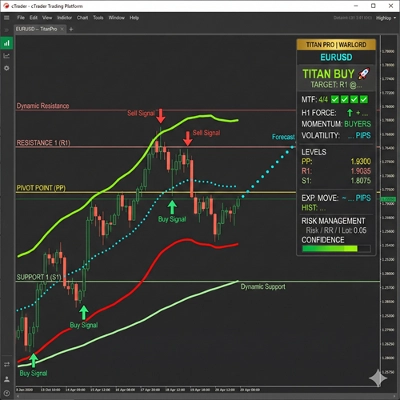
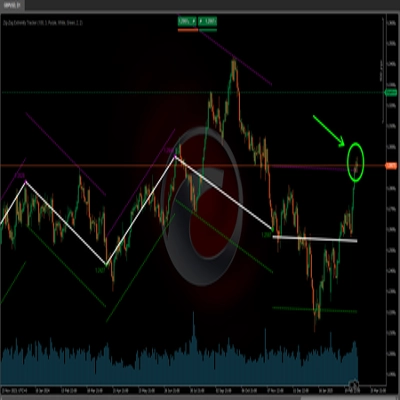
由 [BeyondTrading] 提供的支撑与阻力位及突破 — 查看每一个实时水平和每一次真实突破。 自动检测枢轴高点和低点,并直接在图表上绘制水平支撑和阻力线。只要该水平保持,每条线都会实时逐根K线延伸。价格一旦收盘突破该线,线条即停止——正好在接触点。无需手动绘制,无陈旧水平干扰您的图表。
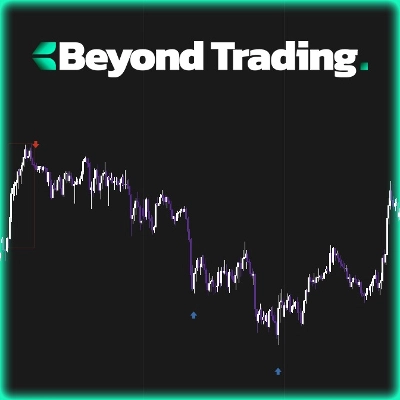
当某个水平被突破时,信号会立即出现: B 表示带有成交量的干净突破,牛市影线 或 熊市影线 表示收盘由影线驱动而非实体收盘。成交量过滤器剔除低信心的波动,仅保留重要信号。
为何支撑/阻力位重要 支撑和阻力位不仅仅是线条——它们是流动性池。每次价格拒绝某个水平时,止损单和挂单都会积聚在其上下方。当价格回归时,机构要么防守该水平,要么在真正行情开始前猎杀停损单。经过三次测试且未被突破的阻力位绝非偶然——那里堆积着卖单,若行情是假突破,突破交易者将被困。了解哪些水平仍有效,哪些已被突破,能准确告诉您下一次反应可能发生的位置。
功能
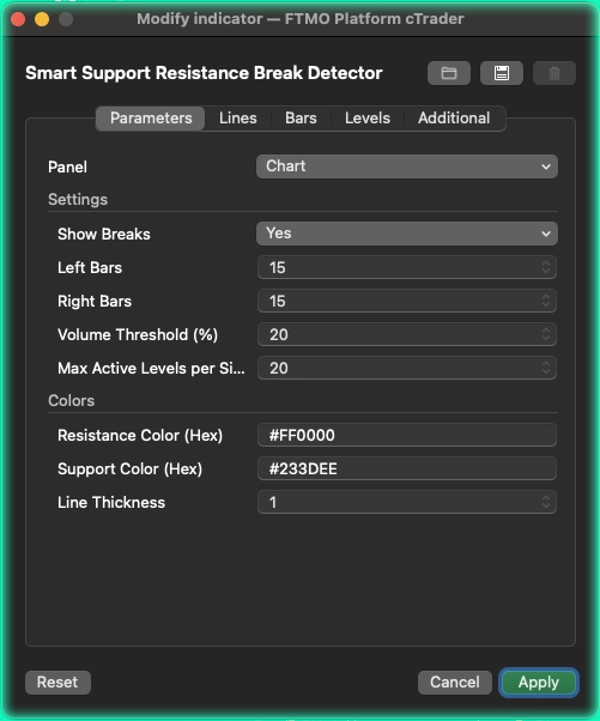
- 可配置的左侧和右侧柱数枢轴检测,适用于各种交易风格
- 线条在每根K线上动态延伸——价格一旦收盘突破即停止
- 成交量过滤器(EMA 5/10 振荡器)区分真实突破与噪音
- 突破标签:B 表示干净的成交量突破,牛市影线和熊市影线表示由影线驱动的波动
- 重复过滤——自动忽略与现有水平过于接近的水平
- 每侧最大激活水平,保持图表清晰易读
- 完全可配置的阻力和支撑颜色,支持十六进制输入
摘要
AI summary
The Smart Support Resistance Break Detector is an indicator that automatically identifies pivot-based support and resistance levels on trading charts. It detects pivot highs and lows and draws horizontal lines that extend in real time as long as the price respects these levels. When the price closes beyond a level, the corresponding line stops exactly at the breakout point, preventing clutter from outdated levels.
The indicator features volume-confirmed break signals to distinguish genuine breakouts from low-conviction moves. It displays specific labels: "B" for clean volume breaks, and "Bull Wick" or "Bear Wick" when breaks are driven by wicks rather than body closes. A volume filter based on EMA oscillators helps filter out noise.
Additional functionalities include configurable pivot detection parameters (Left Bars and Right Bars), automatic filtering of duplicate levels, and limits on the maximum number of active levels per side to maintain chart clarity. Users can customize support and resistance line colors using hex codes.
This tool is designed to highlight key liquidity pools where institutional orders accumulate, aiding traders in identifying active levels and potential reaction points in the market.
指标配置
客户评价
0.0
评价:0
客户评价
该产品尚无评价。已经试过了?抢先告诉其他人!
讨论
常见问答
Key Levels
BOS
Liquidity Sweep
Liquidity Grab
Support & Resistance
cTrader Store 提供的所有产品,包括交易机器人、指标和插件,均由第三方开发者提供,仅供信息参考和技术访问之用。cTrader Store 并非经纪商,不提供投资建议、个人推荐或任何未来业绩保证。









价格
注册日期 21/01/2026
6
销售
254
免费安装