"ATR Ratio SuperTrend" logo
ATR Ratio SuperTrend
"ATR Ratio SuperTrend" uploaded image
Since 21/01/2026
2
Sales
63
Free installs

ATR Ratio SuperTrend by [BeyondTrading]

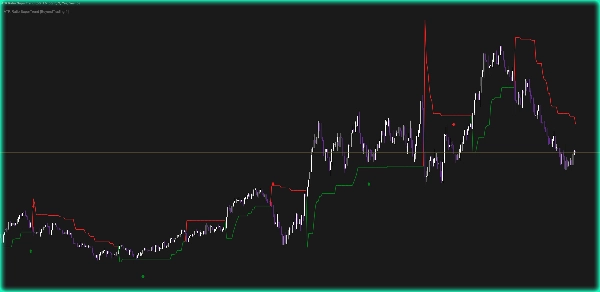
The ATR Ratio SuperTrend merges two complementary tools into a single, decision-focused signal. On one side, the SuperTrend clearly defines market direction β€” green for bullish conditions, red for bearish. On the other, the ATR Ratio evaluates where price stands within its recent volatility range, acting as a filter to eliminate weak or indecisive movements.

The result is simple: you only get signals when there is both direction and real momentum behind the move.

When these two conditions align β€” a confirmed trend and a breakout beyond a meaningful volatility threshold β€” the indicator prints an entry arrow. No repainting, no lagging noise. Just clear, actionable signals built on structure, not randomness.

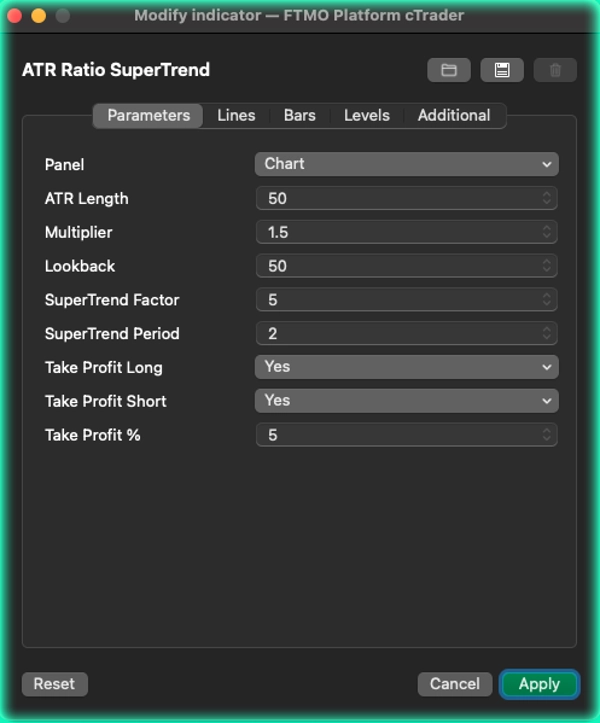
Take Profit management is directly integrated. You define your target percentage, and the indicator automatically tracks and marks exits when price reaches that level. Long and short positions can be configured independently, allowing full control over your risk-reward logic.

What makes it different

Most SuperTrend indicators generate signals on every crossover, regardless of context. That leads to overtrading and low-quality entries. Here, the ATR Ratio acts as a strict filter: signals are only triggered when price is actively breaking out of its volatility range β€” not when it’s simply drifting sideways.

Fewer signals, but significantly higher conviction.

Features

  • SuperTrend line with real-time color change (green uptrend, red downtrend)
  • Entry arrows only on validated high-momentum breakouts
  • Built-in Take Profit detection with automatic visual markers
  • Full customization: ATR length, multiplier, lookback period, ratio factor, and TP percentage


Indicator profile
0.0
Reviews: 0
Customer reviews
No reviews for this product yet. Already tried it? Be the first to tell others!
Prop
Forex
Signal
Indices
Commodities
Crypto
Stocks
Products available through cTrader Store, including trading bots, indicators and plugins, are provided by third-party developers and made available for informational and technical access purposes only. cTrader Store is not a broker and does not provide investment advice, personal recommendations or any guarantee of future performance.

More from this author

Pivot-based Support and Resistance levels that extend until broken, with volume-confirmed break signals
Tracks NY, London, Tokyo, Sydney sessions with custom visuals, and a real-time expanding range box and breakout High/Low
Exhaustion Hunter by BeyondTrading β€” When price hits the limit, the reversal is next.
Multi EMA Timeframes lets you stay on your chart and see the exact EMA from any timeframe you choose β€” up to 5 at once.
Reads trend acceleration, not just direction. Glowing lead line, dynamic channel, auto flip levels.
Asia, London & NY sessions mapped in real time, boxes, VWAP, kill zones, range extensions, and a built-in RSI panel.
Reversal Hunter by BeyondTrading β€” Stop guessing direction. Catch the turn before the crowd.
Adaptive Entropy Trend reads market randomness to filter noise from direction. Smooth trend line, automatic bar coloring

You may also like

heatmap
Market Session Indicator
Session One is a tool for marking from to, useful if you've set the hours you want to trade
The Ultimate RSI is an advanced and enhanced momentum oscillator
"ORB v1" logo
5.0
(1)
$Β 19
Opening Range Breakout (ORB) - Visual Edition
PVA Volume Analysis Indicator:Price volume over trend strength and direction
Smart trendline breakout indicator with auto signals, targets, and ATR-based zones for precise trade execution.
Daily moving averages, simplified. Displays 3 daily moving averages on lower timeframes with selectable MA types.
Multi-timeframe version of the Quantitative Qualitative Estimation (QQE) indicator.
Institution-level trend Analyzer.
Detects Head & Shoulders patterns, plots signals, and alerts for trading opportunities.
Squeeze Momentum Indicator detects market consolidation periods and momentum breakouts using Bollinger Bands.
Trend-coloring Donchian cloud that highlights volatility squeezes and breakouts.
BullBear Dynamics helps traders detect and interpret the balance between bullish and bearish momentum
Stop Loss Pro – Precision Risk Management for Every Trader
Dynamic Liquidity Depth exposes hidden volume
Customize your Moving Average! Choose any timeframe and price source for precision and flexibility in your analysis.
Combines multiple Currency Pairs / Symbols into a single Weighted Average Strength of that currency.
Since 21/01/2026
2
Sales
63
Free installs