
Zigzag Trend
指标
2 购买
版本 1.0, Sep 2025
Windows 版、Mac 版
4.6
评价:3
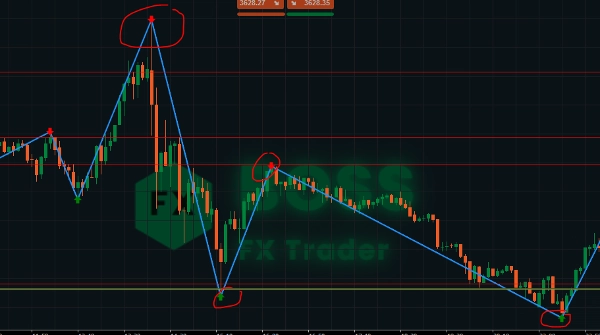
ZigZag 指标 是一种 市场结构工具,它过滤掉小的价格波动并突出显示 主要的波段高点和低点。通过用线连接这些点,交易者可以轻松识别 趋势、反转和图表形态。
它 本身不产生买卖信号,但当与价格行为、支撑/阻力或其他指标结合使用时,对于剥头皮、日内和波段策略非常有效。
🔎 主要特点
- 通过显示 清晰的价格波动 简化市场噪音。
- 帮助识别 支撑和阻力位。
- 有助于发现 图表形态(头肩顶、双顶/双底、三角形)。
- 辅助 趋势确认 和 回调入场。
- 箭头买卖指标
⚡ 使用 ZigZag 进行剥头皮交易
- 时间框架:1分钟 – 5分钟
- 目标:捕捉小而频繁的波动。
- 使用方法:
-
- 等待形成新的波段高点/低点。
- 将其标记为微观支撑或阻力。
- 在 突破 或 回调 到这些 ZigZag 水平时入场交易。
- 将止损设置在 最后一个波段之外(风险控制严格)。
- 目标快速止盈(根据波动性为5–15点)。
👉 最适合 高波动时段(伦敦/纽约开盘)。
⏱️ 使用 ZigZag 进行日内交易
- 时间框架:15分钟 – 1小时
- 目标:交易日内趋势和关键反转点。
- 使用方法:
-
- 利用更高时间框架的 ZigZag 波段识别 主要日内趋势。
- 将 ZigZag 点作为 枢轴区 入场(上升趋势买入回调,下降趋势卖出反弹)。
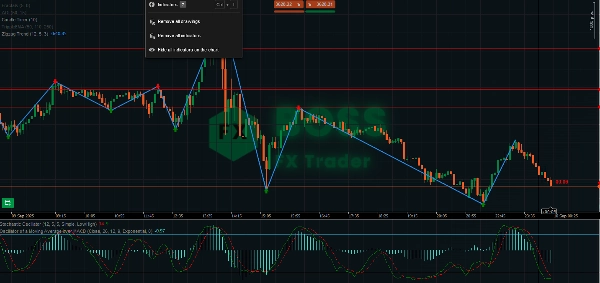
- 结合振荡指标(RSI/随机指标)确认 ZigZag 极值附近的超买/超卖。
- 使用 前一个波段高点/低点 作为合理的止损/止盈水平。
👉 非常适合 日内交易者,目标为20–50点的波动。
📆 使用 ZigZag 进行波段交易
- 时间框架:4小时 – 日线
- 目标:捕捉大趋势波动和持仓交易。
- 使用方法:
-
- 使用 ZigZag 识别 主要市场结构(更高的高点和更高的低点 = 上升趋势)。
- 在上升趋势中,当形成新的波段低点后进行回调入场。
- 将止损设置在最后一个主要波段低点下方。
- 目标为风险的2–3倍,或下一个 ZigZag 波段水平。
- 利用 ZigZag 识别反转形态(双顶/双底,头肩顶)作为退出信号。
👉 适合持仓 数天到数周 的交易者。
📌 专业提示
- 调整深度:较小 = 更敏感(适合剥头皮)。较大 = 过滤噪音(适合波段)。
- 结合 成交量、趋势过滤器或移动平均线 以确认信号。
- 入场前务必检查 更高时间框架的 ZigZag — 较大趋势中的小波动可能是陷阱。
- 使用 ZigZag 进行 图表形态验证(三角形、楔形)。
祝交易者盈利!
指标配置
4.6
评价:3
5 | 67 % | |
4 | 33 % | |
3 | 0 % | |
2 | 0 % | |
1 | 0 % |
客户评价
September 24, 2025
The tool feels better once it makes forced ideas less tempting, and a 1R exit plan makes review easier.
September 20, 2025
September 17, 2025
Signal
Indices
Commodities
GBPUSD
RSI
Bollinger
Scalping
AI
XAUUSD
NAS100
MACD
BTCUSD
Forex
Breakout
EURUSD
NZDUSD
Martingale
Prop
Supertrend
Crypto
Grid
Stocks
ATR
USDJPY
VWAP
cTrader Store 提供的所有产品,包括交易机器人、指标和插件,均由第三方开发者提供,仅供信息参考和技术访问之用。cTrader Store 并非经纪商,不提供投资建议、个人推荐或任何未来业绩保证。
该作者的其他作品


注册日期 29/05/2025
3.03M
交易量
45.22K
盈利点数
28
销售
743
免费安装