

LT_Ind_SRZones
Indikator
5 pembelian
Versi 1.0, Oct 2025
Windows, Mac
4.5
Ulasan: 6

Sejak 25/09/2024
38
Penjualan
Deskripsi
Catatan: Diuji hanya pada cTrader Windows.
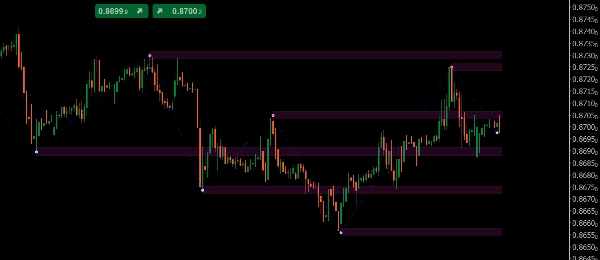
LT_Ind_SRZones mendeteksi swing high/low, menggabungkan swing yang berdekatan menjadi zona Support/Resistance, dan menjaga grafik Anda tetap fokus pada level yang paling relevan di sekitar harga saat ini.
Apa yang digambar
- Zona: pita bayangan yang dibangun dari swing yang digabungkan
- Titik Swing High/Low
- Jalur ZigZag untuk pembacaan struktur cepat
Kontrol Utama
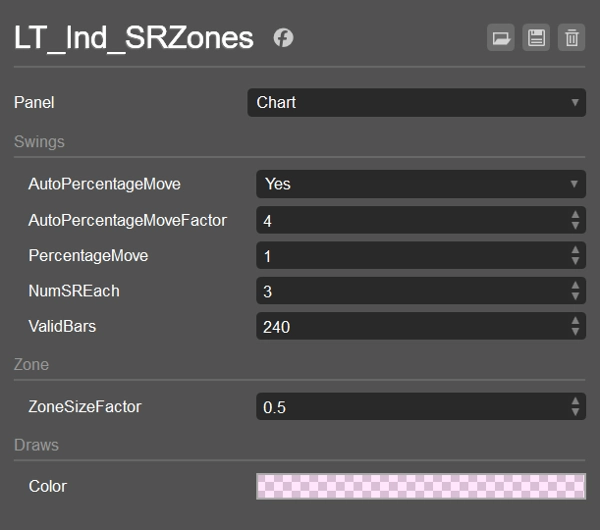
- AutoPercentageMove (bool) + AutoPercentageMoveFactor (double)
Mengatur sensitivitas swing secara otomatis. Matikan untuk menggunakan PercentageMove secara manual. - PercentageMove (double)
Pergerakan minimum (dalam %) untuk membentuk swing saat Auto dimatikan. - ZoneSizeFactor (double)
Tinggi zona =ZoneSizeFactor × ATR. - NumSREach (int)
Berapa banyak zona teratas yang dipertahankan di atas dan di bawah harga saat ini. - ValidBars (int)
Abaikan swing yang lebih tua dari jumlah bar ini. - Warna / Gaya Tampilkan
Warna isi zona (dengan alfa), gaya Swing/ZZ.
Logika Pengurutan & Filter (cara zona dipilih)
- Kumpulkan swing dari yang terbaru ke belakang, hanya yang permanen dan tidak lebih tua dari
ValidBars. - Hitung swing di atas dan di bawah harga saat ini (termasuk yang nilainya berada di dalam setengah zona). Berhenti saat kedua sisi mencapai
NumSREach. - Cadangan: jika suatu sisi tidak memiliki swing yang memenuhi syarat, tambahkan satu swing yang lebih tua untuk sisi tersebut.
- Gabungkan: untuk setiap swing yang berhak, baik menggabungkan ke dalam zona yang sudah ada (
CanMerge) atau membuat zona baru. - Peringkat & pilih:
-
- Di atas harga: urutkan zona berdasarkan (High − price) secara naik, lalu berdasarkan MostRecentIndex secara turun; ambil
NumSREach. - Di bawah harga: urutkan berdasarkan (price − Low) secara naik, lalu berdasarkan MostRecentIndex secara turun; ambil
NumSREach. - Gabungkan kedua daftar → zona akhir yang ditampilkan.
- Di atas harga: urutkan zona berdasarkan (High − price) secara naik, lalu berdasarkan MostRecentIndex secara turun; ambil
Ini menjaga tampilan bersih, dekat, dan terbaru, sambil tetap menangani kasus tepi.
Default
- AutoPercentageMove = true, AutoPercentageMoveFactor = 4
- PercentageMove = 1.0 (digunakan saat Auto = false)
- NumSREach = 1
- ValidBars = 240
- ZoneSizeFactor = 0.5 (tinggi zona = 0.5 × ATR)
- Warna Zona = #21FF33E0 (semi-transparan)
- Swing High = #FFFF999A, Swing Low = #FF99DFF9, ZigZag = Biru (Titik)
Kasus Penggunaan
- Tandai zona S/R yang dekat untuk entri, parsial, atau stop
- Amati perubahan zona (support → resistance dan sebaliknya)
- Gabungkan dengan VWAP/Pivots untuk konfluensi
Bekerja pada simbol dan timeframe apa pun. Ringan dan siap untuk trading langsung atau backtest.
Ringkasan
AI summary
LT_Ind_SRZones is an indicator designed for cTrader Windows that automatically identifies and displays support and resistance zones derived from swing highs and lows. It detects swing points, merges nearby swings into shaded support/resistance zones, and highlights the most relevant levels around the current price to maintain a clear chart view. The indicator also plots swing high/low points and a ZigZag path for quick structural analysis.
Key adjustable parameters include automatic or manual swing sensitivity settings, zone size based on a factor of the Average True Range (ATR), the number of top zones to display above and below the current price, and the maximum age of swings considered. The indicator filters and ranks zones by proximity and recency, ensuring the display focuses on recent and nearby levels.
LT_Ind_SRZones works on any symbol and timeframe, supporting markets such as Forex, indices, commodities, cryptocurrencies, and stocks. It is suitable for live trading and backtesting. Typical use cases include marking nearby support/resistance zones for trade entries, stops, or partial exits, monitoring zone flips (support to resistance and vice versa), and combining with other indicators like VWAP or pivots for confluence.
Key adjustable parameters include automatic or manual swing sensitivity settings, zone size based on a factor of the Average True Range (ATR), the number of top zones to display above and below the current price, and the maximum age of swings considered. The indicator filters and ranks zones by proximity and recency, ensuring the display focuses on recent and nearby levels.
LT_Ind_SRZones works on any symbol and timeframe, supporting markets such as Forex, indices, commodities, cryptocurrencies, and stocks. It is suitable for live trading and backtesting. Typical use cases include marking nearby support/resistance zones for trade entries, stops, or partial exits, monitoring zone flips (support to resistance and vice versa), and combining with other indicators like VWAP or pivots for confluence.
Profil indikator
Ulasan pelanggan
4.5
Ulasan: 6
5 | 50 % | |
4 | 50 % | |
3 | 0 % | |
2 | 0 % | |
1 | 0 % |
Ulasan pelanggan
October 26, 2025
Good enough to keep watching for another week. A clean signal can still fail.
October 25, 2025
The logic holds up when bad setups become easier to pass on. It works better with a written plan.
October 22, 2025
October 15, 2025
the routine feels easier to keep, but the chart still needs a human read.
Diskusi
Pertanyaan umum
Prop
Forex
Indices
Commodities
Crypto
Stocks
Produk-produk yang tersedia melalui cTrader Store, termasuk bot trading, indikator, dan plugin, disediakan oleh pengembang pihak ketiga serta hanya ditujukan untuk akses teknis dan informasi. cTrader Store bukan broker dan tidak menyediakan saran investasi, rekomendasi pribadi, atau jaminan apa pun tentang kinerja di masa mendatang.

























Harga
Sejak 25/09/2024
38
Penjualan