
说明
注意:仅在 cTrader Windows 上测试。
LT_SmartSwings 是一个强大的基于摆动的市场结构指标,旨在帮助交易者清晰灵活地可视化关键转折点、市场走势和突破事件。该工具以精准和适应性为设计理念,非常适合依赖摆动逻辑、斐波那契汇聚和突破分析的交易者。
核心功能:
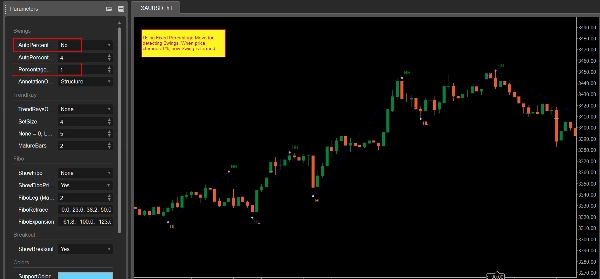
- 摆动高点/低点检测 基于价格变动百分比
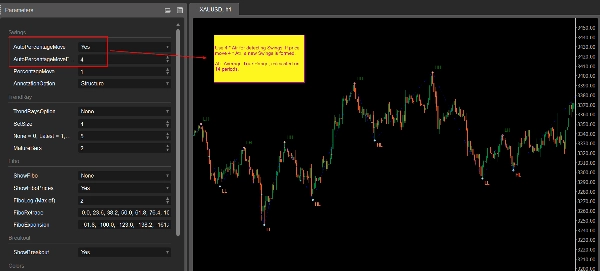
- 自动或手动阈值: 使用固定百分比或自动模式(基于 ATR x 因子)
- 之字形线 连接关键摆动点
- 详细注释 具有5种模式:
-
- 结构:HH,HL,LH,LL
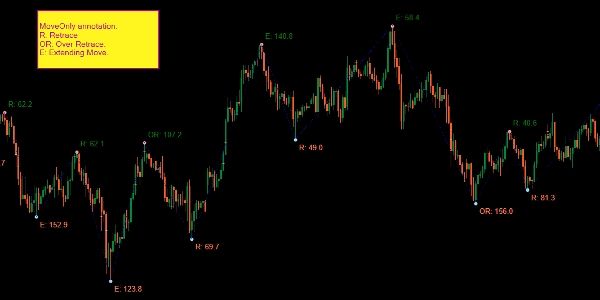
- 仅移动:回撤(R)和扩展(E)百分比
- 仅价格
- 移动与价格
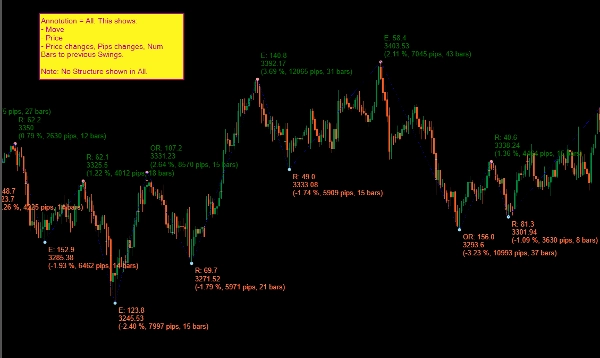
- 全部:移动百分比,点数,柱数,价格,移动类型
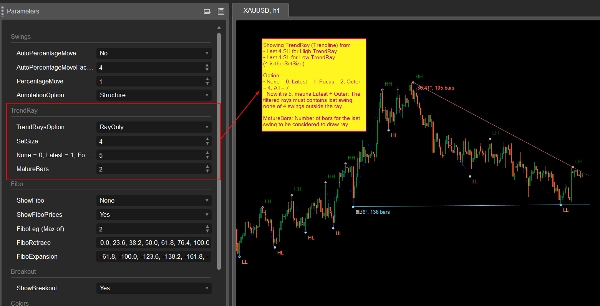
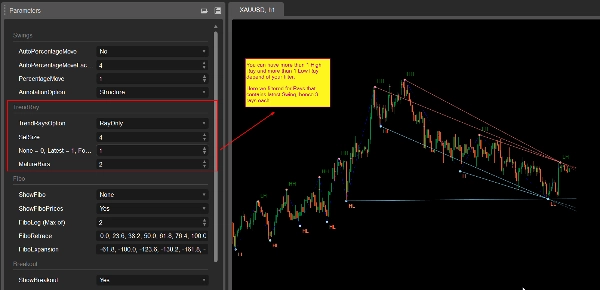
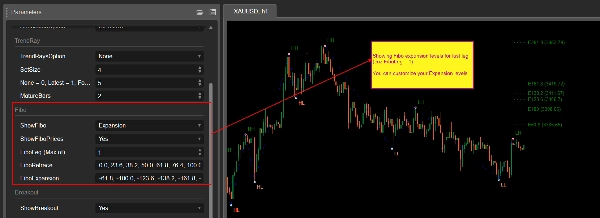
- 趋势射线投影(带多种过滤选项):
-
- 使用智能约束从最近摆动点绘制射线
- 选项:最新,焦点(斜率),外部,或全部
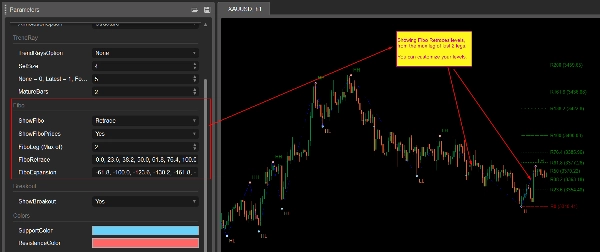
- 自动斐波那契水平:
-
- 基于最近走势绘制回撤或扩展水平
- 用户可配置的水平集
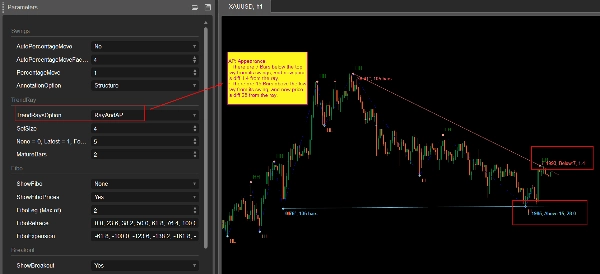
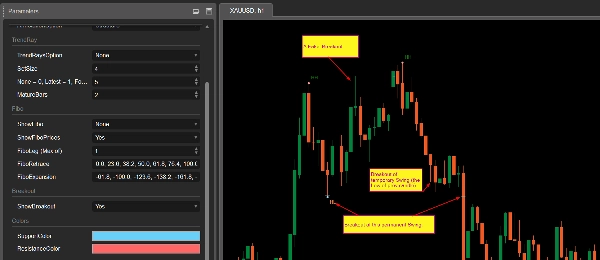
- 突破标记:
-
- 检测摆动点突破(包括确认和假突破)
- 历史参考的持久显示
- 颜色自定义 用于支撑/阻力线
使用案例:
- 动态识别支撑/阻力
- 理解摆动结构和转变
- 利用斐波那契判断趋势延续或反转
- 可视化突破点以便交易计划
- 与现有系统或自由裁量策略结合使用
推荐使用:
- 附加到您的工作时间框架(例如,M30,H1)
- 最适合手动交易者、结构分析师和基于确认的策略
启动优惠:现仅售 $15!
摘要
AI 摘要
LT_SmartSwings is a swing-based market structure indicator designed for traders to identify key turning points, market moves, and breakout events with precision and flexibility. It detects swing highs and lows based on price movement percentage, using either fixed or automatic thresholds derived from ATR. The indicator connects key swings with a ZigZag line and provides detailed annotations in five modes, including structure (HH, HL, LH, LL), move percentages, price-only, combined move and price, and comprehensive move data.
Additional features include trend ray projection with multiple filtering options, automatic Fibonacci retracement and expansion levels customizable by the user, and breakout marking that detects both confirmed and false breakouts with persistent historical display. Support and resistance lines can be color-customized.
Use cases cover dynamic support/resistance identification, understanding swing structure and transitions, spotting trend continuation or reversal via Fibonacci levels, visualizing breakout points for trade planning, and integration with existing trading systems or discretionary strategies. It is recommended for manual traders, structure analysts, and confirmation-based strategies, and is intended for use on working timeframes such as M30 or H1. The indicator has been tested on cTrader Windows.
指标配置
客户评价
5.0
评价:1
5 | 100 % | |
4 | 0 % | |
3 | 0 % | |
2 | 0 % | |
1 | 0 % |
讨论
常见问答
Breakout
ATR
cTrader Store 提供的所有产品,包括交易机器人、指标和插件,均由第三方开发者提供,仅供信息参考和技术访问之用。cTrader Store 并非经纪商,不提供投资建议、个人推荐或任何未来业绩保证。


价格
注册日期 25/09/2024
34
销售