
FVG_tidypips
Indicador
13 compras
Versão 1.0, Nov 2024
Windows, Mac
4.3
Avaliações: 3

Descrição
Este Indicador de Gap de Valor Justo (FVG) é uma ferramenta de análise técnica que ajuda os traders a identificar desequilíbrios de preço.
Características:
- Alternar visibilidade dos gaps de alta e/ou baixa
- Exibe caixas codificadas por cores para fácil visualização (padrão: verde para alta, vermelho para baixa, dourado para níveis intermediários)
- Período de retrocesso ajustável para reduzir a desordem no gráfico
- Configuração ajustável de extensão da caixa (offset) para melhor visualização
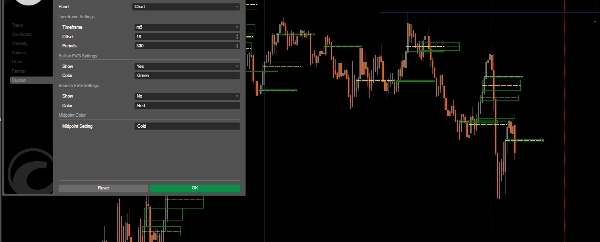
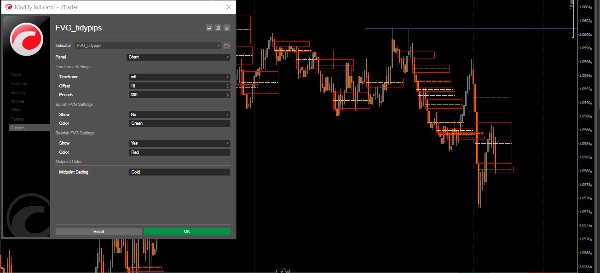
Parâmetros:
- Timeframe: Selecione seu timeframe preferido para exibir os FVGs
- Offset: Ajuste a extensão horizontal das caixas FVG (3-500)
- Períodos: Defina o período de retrocesso para o cálculo histórico dos FVGs
- Mostrar FVGs de Alta/Baixa
- Cores: Personalize as cores para FVGs de alta, FVGs de baixa e linhas intermediárias
Aplicações de Trading:
- Suporte e Resistência: FVGs frequentemente atuam como níveis fortes de suporte/resistência
- Ímãs de Preço: Gaps não preenchidos tendem a atrair a ação do preço (DOL)
- Estrutura de Mercado: Ajuda a identificar zonas potenciais de reversão e pontos de continuação de interesse
- Análise de Bloco de Ordem: Identifique zonas de negociação institucional
Melhores Práticas de Aplicação:
- Use em conjunto com outras ferramentas de análise técnica.
- Timeframes mais altos produzem FVGs mais significativos, timeframes mais baixos usados com Bias Direcional de timeframe mais alto
- Monitore como o preço reage ao retornar às zonas de FVG
- Preste atenção à linha intermediária, pois frequentemente serve como um ímã de preço
Confira outros indicadores úteis que publiquei. Se você achar este ou qualquer outro dos meus indicadores útil, considere apoiar meu trabalho comprando ou doando. Seu apoio não só me ajuda a continuar desenvolvendo e aprimorando essas ferramentas, mas também garante que eu possa continuar criando novos indicadores valiosos para melhorar sua experiência de trading. Obrigado pelo seu apoio contínuo!
https://buymeacoffee.com/tidypips
Resumo
Resumo de IA
The FVG_tidypips indicator is a technical analysis tool designed to identify Fair Value Gaps (FVGs), which represent price imbalances on trading charts. It visually highlights bullish and bearish gaps using color-coded boxes—green for bullish, red for bearish, and gold for midpoint levels—facilitating quick recognition of potential support and resistance zones. Users can toggle the visibility of bullish and/or bearish gaps, adjust the lookback period to manage chart clutter, and configure the horizontal extension (offset) of the FVG boxes for clearer visualization.
Key parameters include selecting the timeframe for FVG display, setting the offset range (3–500), defining the lookback period for historical gap calculation, and customizing colors for different gap types and midpoint lines. The indicator supports trading applications such as identifying strong support/resistance levels, spotting price magnets where unfilled gaps attract price action, analyzing market structure for potential reversal or continuation zones, and detecting institutional order block areas.
Best practices recommend using this indicator alongside other technical tools, focusing on higher timeframes for more significant FVGs, and monitoring price reactions when revisiting FVG zones. The midpoint line is noted as an important price magnet. This tool is applicable across various markets, including commodities like gold (XAUUSD).
Perfil do indicador
Avaliações de clientes
4.3
Avaliações: 3
5 | 33 % | |
4 | 67 % | |
3 | 0 % | |
2 | 0 % | |
1 | 0 % |
Avaliações de clientes
November 22, 2024
Good idea with limits for traders who use ICT or SMC concepts. It gives value around smart money style analysis, but zones still need manual validation. A good sample is 20 FVG or order block reactions, with messy 0.705 areas skipped. The zone is more convincing when structure and risk both make sense.
November 21, 2024
November 21, 2024
Small but practical edge for smart money style analysis. it adds structure around liquidity, gaps and market shifts, especially when used for mapping zones before entries. For SMC logic, I trust zones more when 0.5 mitigation, BOS and liquidity sweep line up. The zone is more convincing when structure and risk both make sense.
Conversa
Perguntas frequentes
Commodities
XAUUSD
Os produtos disponíveis através da cTrader Store, incluindo bots de negociação, indicadores e plugins, são fornecidos por programadores terceiros e são disponibilizados apenas para fins informativos e de acesso técnico. A cTrader Store não é um corretor e não fornece aconselhamento em matéria de investimento, recomendações pessoais ou qualquer garantia de desempenho no futuro.
Mais deste autor


Preço
15
Vendas
4.65K
Instalações gratuitas