
Descrição
Cansado de passar uma eternidade marcando seus gráficos? Este indicador faz isso para você super rápido.
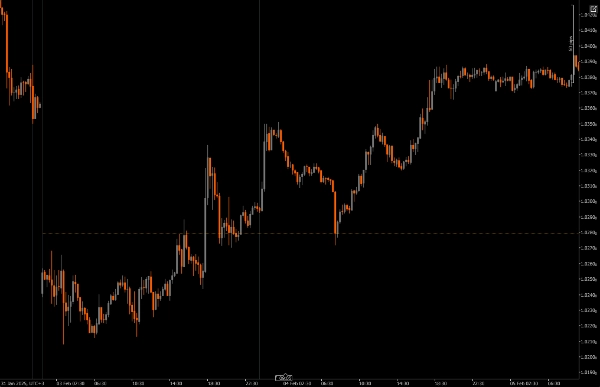
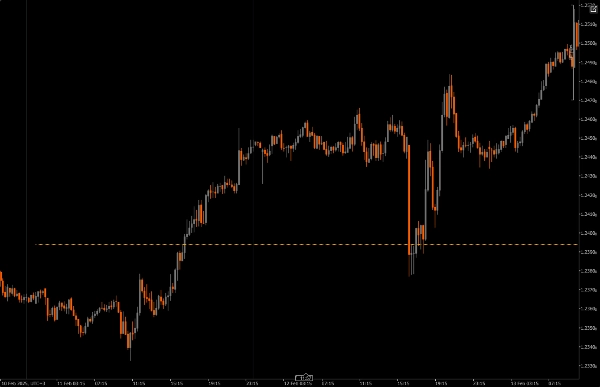
Ele encontra o ponto médio entre a máxima e a mínima do dia anterior e o plota em seus gráficos. Agora você pode analisar seus gráficos super rápido. Moleza!
Algumas Funcionalidades Legais
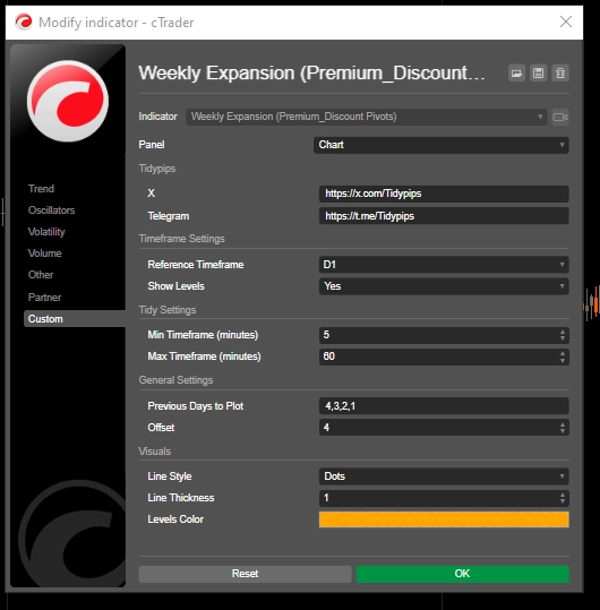
Intervalo de Tempo de Referência Personalizável: Você pode escolher um intervalo mínimo e máximo para plotar níveis significativos de preço, o que ajuda a alinhar suas operações intradiárias com tendências de mercado mais amplas.
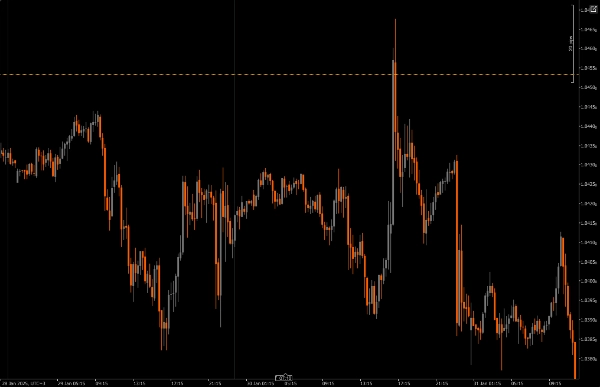
O que torna este indicador especial é a capacidade de seguir a vela semanal conforme ela se forma dia a dia, facilitando capturar a expansão da vela semanal.
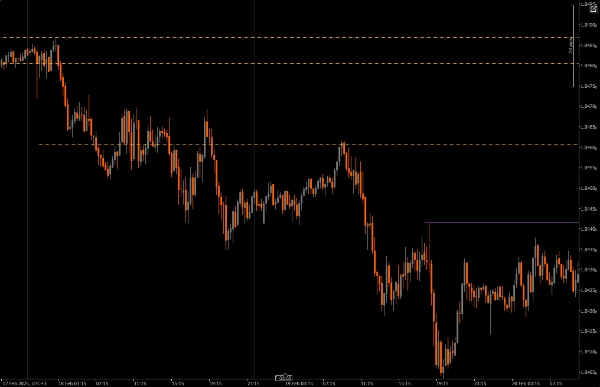
Parâmetro de Deslocamento: Este recurso permite que você decida até onde no futuro os níveis plotados se estendem, dando uma visão mais clara das possíveis zonas de continuação futura do preço.
Personalização Visual: Você tem muitas opções para ajustar estilos de linha, espessura e cores, facilitando criar um gráfico que combine com seu estilo pessoal e seja fácil de ler.
Restrições de Intervalo de Tempo: O indicador inclui verificações para garantir que ele funcione apenas dentro das configurações de intervalo de tempo especificadas, para que você possa evitar a desordem no gráfico ao alternar entre outros intervalos.
Pontos a Notar:
Um favorito pessoal
Se você é como eu e não consegue ficar longe do batom nos seus gráficos, experimente este indicador. Possui restrições de intervalo de tempo e funcionalidade de período de retrocesso visando reduzir a desordem no gráfico.
Este indicador é útil para acompanhar como a vela semanal se desenvolve; se a expansão semanal mostrar sinais de fluxo de ordens de alta, então os níveis pivot deste indicador visualizam áreas ou zonas para se juntar à expansão de alta; da mesma forma, se a expansão semanal mostrar um fluxo de ordens de baixa, então os níveis pivot deste indicador visualizam áreas ou zonas para se juntar à expansão de baixa.
Instalação: Comece baixando e instalando o Previous Day Equilibrium na sua plataforma cAlgo.
Configuração: Abra as configurações para escolher seu intervalo de tempo de referência, selecione quantos dias anteriores deseja plotar e personalize as configurações visuais ao seu gosto.
Análise: Enquanto você negocia, fique de olho nos níveis plotados no seu gráfico. Esses níveis indicam onde o preço pode reverter, baseando-se na ação histórica do preço, ajudando você a tomar decisões mais informadas.
Execução: Use esses níveis para determinar seus pontos de entrada e saída, assim como ordens de stop-loss e take-profit, integrando-os à sua estratégia geral de negociação.
Ferramentas Complementares Recomendadas:
cTrader: Esta é a melhor plataforma para usar o Previous Day Equilibrium, proporcionando uma experiência suave para personalização e análise.
Ferramentas de Análise Técnica: Combine este indicador com outras ferramentas como médias móveis ou osciladores para obter uma visão mais completa das tendências do mercado.
Ferramentas de Gestão de Risco: Utilize calculadoras e ferramentas de stop-loss para ajudar a gerenciar seu risco de forma eficaz enquanto negocia em torno desses níveis-chave.
Ao usar o Previous Day Equilibrium, junto com essas ferramentas, você pode aprimorar sua estratégia de negociação e aumentar suas chances de sucesso no mundo acelerado do trading intradiário.
Resumo
Avaliações de clientes
5 | 0 % | |
4 | 100 % | |
3 | 0 % | |
2 | 0 % | |
1 | 0 % |


