
Descripción
TheVibe NASDAQ Liquidity Cycles es un resaltador de sesiones de nivel profesional diseñado específicamente para el NASDAQ 100. Elimina la necesidad de rastrear manualmente las diferencias horarias o adivinar cuándo aumentará el volumen al poner las horas exactas del mercado de Nueva York visualmente justo frente a ti.
Debido a que la lógica se basa en el tiempo absoluto en lugar de en el conteo de barras, este indicador es completamente independiente del marco temporal, funcionando perfectamente tanto si haces scalping en un gráfico de 1 minuto como si haces swing trading en un gráfico de 1 hora.
Para quién es y cómo usarlo: Este indicador está diseñado para traders diarios y traders de momentum que dependen de una sincronización precisa y de la volatilidad impulsada por volumen puro para sus configuraciones.
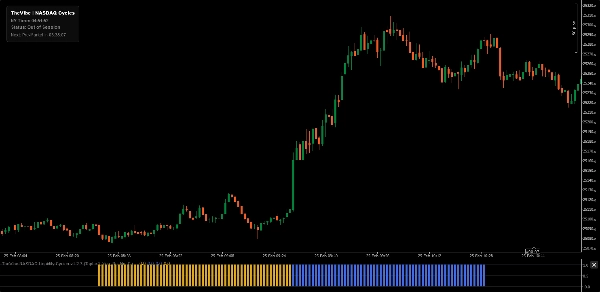
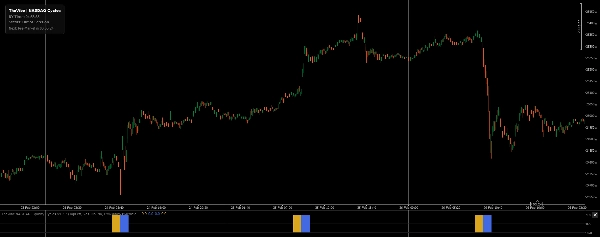
- Interpretación: El indicador traza bloques sólidos de histograma codificados por colores en la subventana cada vez que una sesión clave de liquidez está activa. Al tener estos datos de tiempo visualmente mapeados en tu pantalla, puedes alinear fácilmente tu trading con ventanas de alta probabilidad y evitar períodos irregulares y de baja liquidez sin necesidad de consultar un reloj externo.
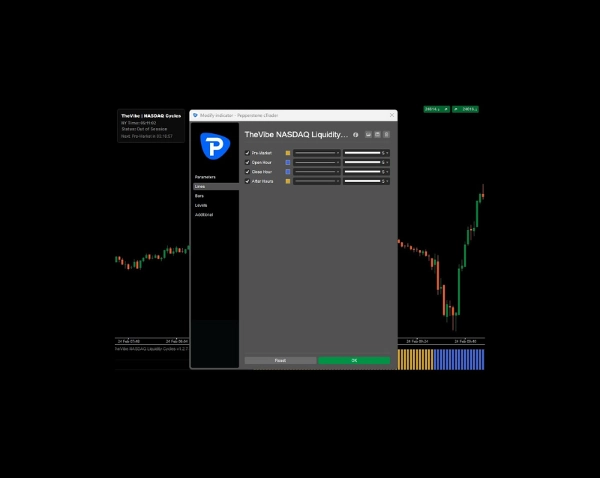
Fases principales de liquidez rastreadas:
- Pre-Mercado (8:30 AM - 9:30 AM NY): La hora institucional de Pre-Mercado, enfocada en noticias de alto impacto y posicionamiento temprano.
- Hora de apertura (9:30 AM - 10:30 AM NY): La ventana de volatilidad de la campana de apertura, esencial para el descubrimiento inicial de precios y el aumento de volumen.
- Hora de cierre (3:00 PM - 4:00 PM NY): La "Hora Poderosa" y cierre cruzado, destacando el momentum institucional de última hora y el cierre de posiciones.
- Después del horario (4:00 PM - 5:00 PM NY): La hora de liquidación post-mercado, capturando la fase final de liquidez al concluir el trading estándar.
Características clave:
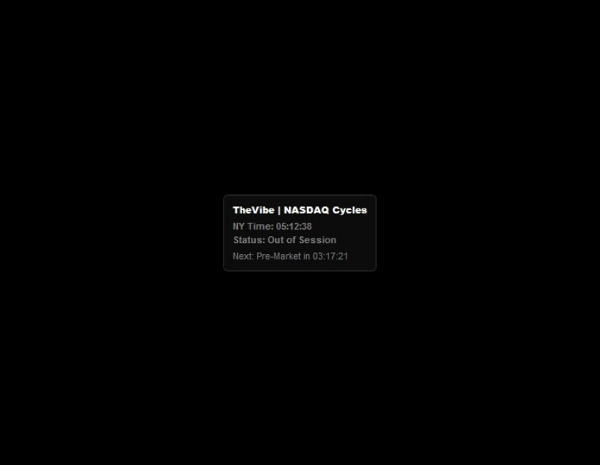
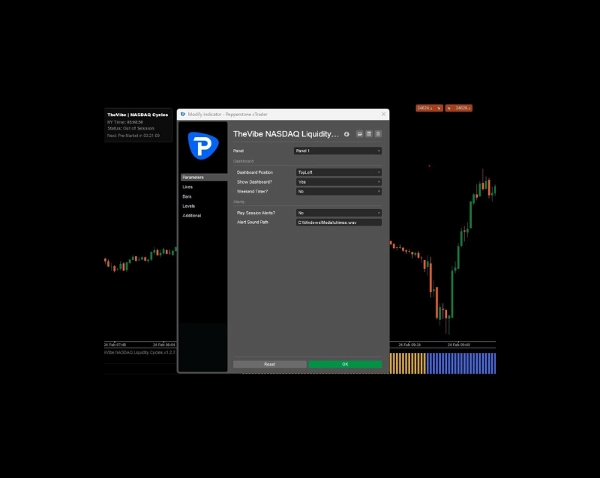
- Panel interactivo de cuenta regresiva: Un HUD dinámico en el gráfico que muestra la hora exacta de Nueva York, tu sesión activa actual y una cuenta regresiva en vivo para la próxima ventana de liquidez.
- Posicionamiento dinámico: Ajusta el panel a cualquiera de las cuatro esquinas de tu gráfico (por defecto en la esquina inferior izquierda) para mantener tu acción de precio completamente despejada.
- Motor avanzado de zonas horarias: Sincroniza automáticamente tu hora local o la del servidor del broker con la hora exacta de Nueva York (maneja EST/EDT automáticamente).
- Lógica inteligente para fines de semana: Elige ocultar la cuenta regresiva durante el fin de semana o mostrar los días y horas exactos restantes hasta la apertura del Pre-Mercado del lunes.
- Alertas de audio: Tonos de notificación opcionales que se activan en el momento exacto en que una ventana de liquidez objetivo se abre o cierra.
Recomendación de visualización: Para una gestión óptima del espacio de trabajo, ajusta la altura de la subventana del indicador a un tamaño compacto. Esto te ofrece una barra de "ritmo" clara y discreta de la liquidez del día mientras preserva el máximo espacio en pantalla para tu gráfico principal de precios.
Nota: El temporizador automático de cuenta regresiva asume horas estándar de trading de lunes a viernes y no considera automáticamente los días festivos públicos de EE.UU. ni cierres anticipados del mercado.
Resumen
Valoraciones de clientes
5 | 0 % | |
4 | 100 % | |
3 | 0 % | |
2 | 0 % | |
1 | 0 % |
![Logotipo de "Smart Money Concepts (SMC) [Iridio Capital]"](https://cdn.ctrader.com/image/webp/28b69fd1-ef54-4bed-9487-07e78e883be4_40934)


