Descripción
Permite a los usuarios marcar los horarios de apertura y cierre de las principales sesiones de trading: asiática, Londres, Nueva York y cierre de Londres, con colores, estilos y grosores personalizables. Este indicador dibuja líneas de tendencia altas y bajas para cada sesión, proporcionando información sobre el comportamiento del mercado. Con una funcionalidad fácil de usar de arrastrar y soltar (+ tecla Alt), facilita la rápida trazabilidad de los máximos y mínimos de las sesiones. Perfecto tanto para traders novatos como experimentados, este indicador facilita la navegación por las complejidades de las diferentes sesiones del mercado.
Características
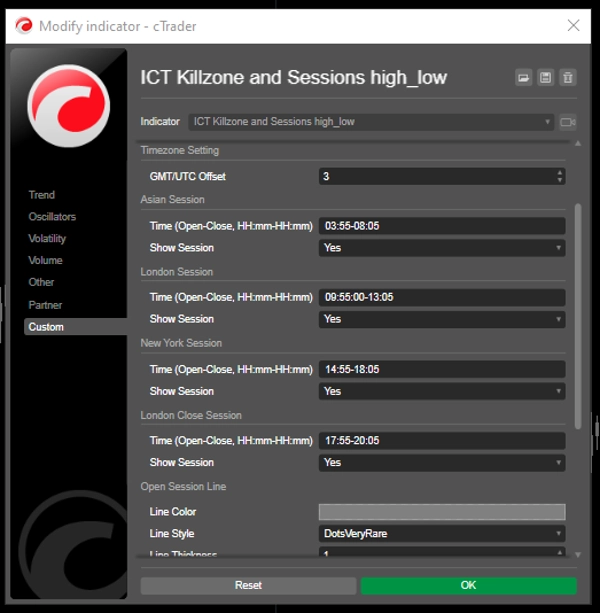
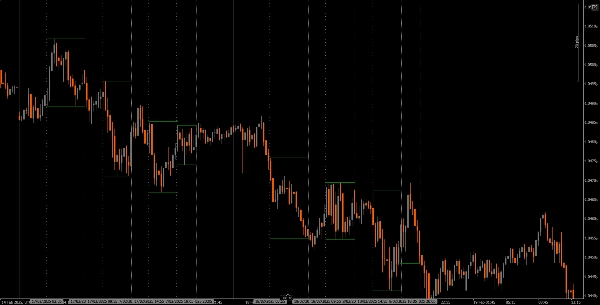
Tiempos de sesión personalizables: Los usuarios pueden definir los horarios de apertura y cierre para las principales sesiones de trading (asiática, Londres, Nueva York y cierre de Londres), permitiendo una visualización adaptada que se ajuste a sus estrategias de trading.
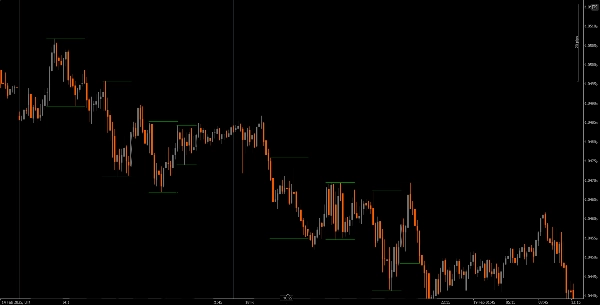
Líneas verticales dinámicas: El indicador dibuja líneas verticales en los horarios de apertura y cierre de las sesiones, facilitando la identificación rápida de eventos clave del mercado.
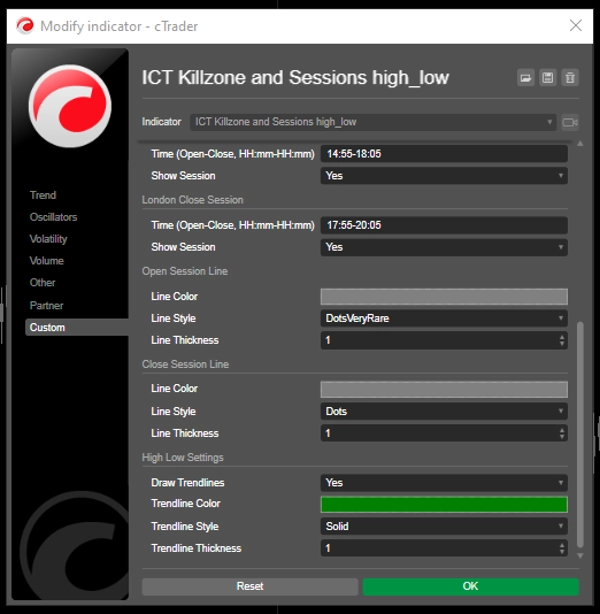
Visualización de líneas de tendencia: Puede dibujar automáticamente líneas de tendencia altas y bajas para cada sesión, permitiendo a los traders ver niveles potenciales de soporte y resistencia basados en la acción del precio de la sesión.
Funcionalidad fácil de usar de arrastrar y soltar (+ tecla Alt): La funcionalidad de arrastrar y soltar (+ tecla Alt) permite a los traders seleccionar fácilmente rangos de tiempo específicos para analizar, mejorando la experiencia general del usuario.
Etiquetas de sesión: La opción de mostrar etiquetas junto a las líneas de tendencia de la sesión añade claridad, ayudando a los traders a identificar rápidamente qué sesión están analizando.
Ajuste de zona horaria: Los usuarios pueden establecer un desfase GMT/UTC, asegurando que los horarios de las sesiones se representen con precisión según su zona horaria local.
Tutorial
Instalación: Descargue e instale el indicador The ICT Killzone and Sessions high_low en su plataforma cAlgo.
Configuración: Abra los ajustes para personalizar los horarios de sesión, colores, estilos de línea y grosores según sus preferencias.
Uso del indicador: Haga clic y arrastre (+ tecla Alt) en el gráfico para crear un rectángulo que abarque el rango de tiempo que desea analizar. El indicador dibujará automáticamente líneas verticales y líneas de tendencia para las sesiones especificadas.
Análisis: Observe las líneas de sesión y las líneas de tendencia mientras opera. Use esta información para identificar niveles potenciales de soporte y resistencia basados en la dinámica de la sesión.
Herramientas complementarias recomendadas
cTrader: La plataforma nativa para cAlgo, que ofrece una experiencia fluida para usar y personalizar indicadores.
Herramientas de análisis de mercado: Combine este indicador con herramientas de análisis de mercado, como medias móviles u osciladores, para mejorar su estrategia de trading.
Herramientas de gestión de riesgos: Use calculadoras de tamaño de posición y herramientas de stop-loss para gestionar eficazmente el riesgo mientras opera.
Al integrar el indicador The ICT Killzone and Sessions high_low con estas herramientas, los traders pueden mejorar su análisis de mercado y aumentar sus posibilidades de éxito al navegar por las complejidades de las diferentes sesiones de trading.
Resumen
A drag-and-drop (+Alt Key) feature allows quick selection of specific time ranges for analysis. Optional session labels clarify which session is being viewed. Timezone adjustments via GMT/UTC offset ensure session times align with the trader’s local time zone.
Designed for use on the cAlgo platform, this tool supports enhanced market analysis when combined with other market analysis and risk management tools. It assists traders in navigating the complexities of different market sessions by providing clear visual cues and trendline insights.
Valoraciones de clientes
5 | 40 % | |
4 | 20 % | |
3 | 0 % | |
2 | 0 % | |
1 | 40 % |