
설명
이것은 보다 현대적인 모양과 느낌을 위해 맞춤화된 간단한 볼륨 프로파일 지표입니다.
이 기본 버전은 3개의 '되돌아보기 기간'으로만 제한됩니다.
전체 버전이 곧 출시될 예정이니 이 공간을 주목해 주세요.
행운을 빕니다!
요약
AI 요약
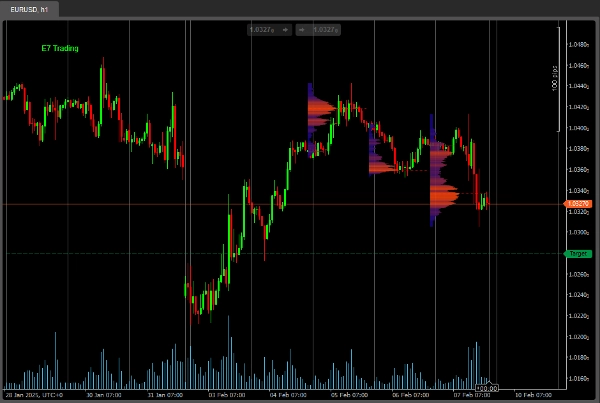
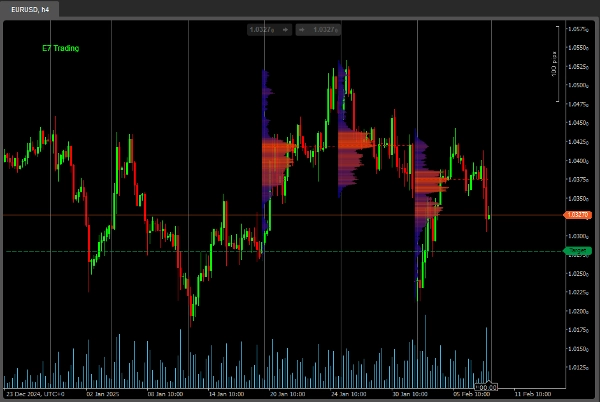
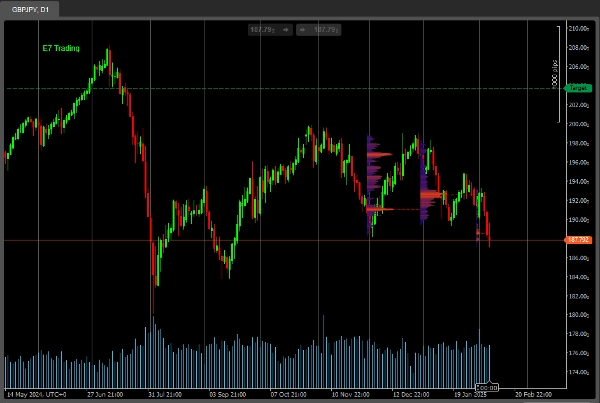
E7 Volume Profile is a volume profile indicator designed with a modern visual style. It provides traders with volume distribution information over price levels, helping to identify key support and resistance areas. This basic version supports analysis over three distinct lookback periods, allowing users to observe volume patterns within limited historical ranges. The indicator is suitable for use on various timeframes, as illustrated by examples on 1-hour, 4-hour, and daily charts. A full version with expanded features is planned for future release.
지표 프로필
고객 리뷰
4.6
리뷰: 3
5 | 67 % | |
4 | 33 % | |
3 | 0 % | |
2 | 0 % | |
1 | 0 % |
고객 리뷰
July 14, 2025
Pros: Clearly visualizes volume distribution with POC, VAH, VAL zones. Customizable and stable across timeframes. Cons: No tooltips or alerts. Lacks template saving and dynamic profile history. Requires confirmation tools for trading signals.
상담
자주 묻는 질문(FAQ)
트레이딩 봇, 지표, 플러그인 등 cTrader Store에서 제공되는 상품은 제3자 개발자에 의해 제공되며, 이는 단순히 정보 및 기술적 접근을 목적으로 제공된 것입니다. cTrader Store는 중개인이 아니며, 투자 조언, 개인별 추천 또는 향후 성과에 대한 어떠한 보장도 제공하지 않습니다.
이 작성자의 상품 더 보기


좋아하실 만한 다른 항목


가격
가입일 18/12/2024
2
판매
4.27K
무료 설치