
Opis
BullBear Dynamics — wskaźnik trendu i momentum dla cTrader
BullBear Dynamics to solidny, uwzględniający zmienność wskaźnik dla platformy cTrader, stworzony, aby pomóc traderom wykrywać i interpretować równowagę między byczym a niedźwiedzim momentum na rynku. Łączy średnie kroczące, normalizację ATR oraz dynamiczne progi, aby dostarczyć precyzyjne, wizualnie intuicyjne narzędzie do oceny trendu.
Metodologia i logika wewnętrzna
Wskaźnik oblicza dwie wykładnicze średnie kroczące (EMA): krótkoterminową EMA i długoterminową EMA.
Następnie bierze różnicę między tymi EMA i dzieli ją przez Average True Range (ATR). Ta normalizacja pomaga dostosować sygnały momentum do aktualnej zmienności rynku.
Linia sygnału — EMA zastosowana do znormalizowanych wartości — filtruje szumy i wygładza drobne wahania.
Aby odróżnić słabe od silnych ruchów, narzędzie oblicza kroczącą odchylenie standardowe (StdDev) w oknie czasowym i mnoży je przez współczynnik, definiując progi górne i dolne.
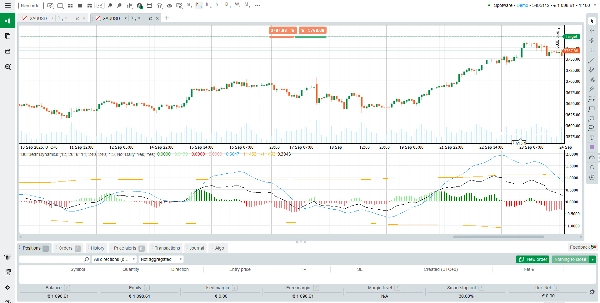
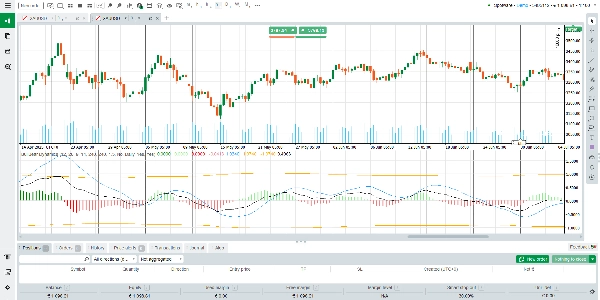
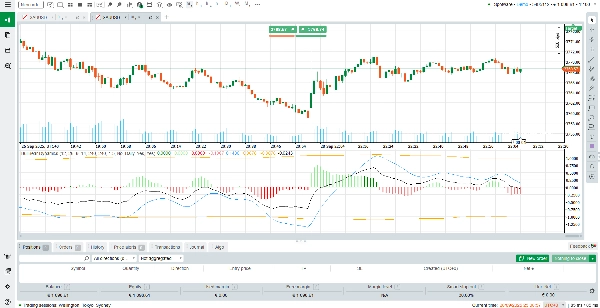
Końcowy wynik jest wizualizowany jako histogram (z wieloma stanami kolorystycznymi) wraz z linią sygnału i granicami progów.
Jak czytać i interpretować wynik
Słupki histogramu (zielone / czerwone):
• Zielony oznacza bycze momentum; czerwony oznacza niedźwiedzie momentum.
• Silny kolor (jaśniejszy lub pełniejszy) oznacza, że histogram przekracza próg — co sugeruje silny ruch.
• Słabszy kolor oznacza, że histogram pozostaje w granicach progów — co sugeruje łagodne momentum lub szum.
Linia sygnału:
• Pełni rolę linii odniesienia.
• Gdy histogram przecina linię sygnału od dołu, sygnalizuje to potencjalne wzmocnienie byczego momentum.
• Gdy przecina ją od góry, sygnalizuje potencjalne wzmocnienie niedźwiedziego momentum.
Linie progowe (górna i dolna):
• Te przerywane linie definiują strefy istotności.
• Słupek histogramu przekraczający próg oznacza silny, pewny ruch momentum.
• Słupki pozostające w granicach progów sugerują zakres lub niezdecydowanie — sygnały są mniej wiarygodne.
Scenariusze i odczyty:
Bycze momentum — zielone słupki powyżej linii sygnału, najlepiej także przekraczające górny próg.
Niedźwiedzie momentum — czerwone słupki poniżej linii sygnału, najlepiej także przekraczające dolny próg.
Neutralne / zakresowe — słupki oscylują w granicach progów, kolory mogą się zmieniać, mała amplituda.
Zmiana lub odwrócenie momentum — histogram przecina linię sygnału, towarzyszy temu zmiana koloru; jeśli również przebija próg, większa wiarygodność.
Sugestie dotyczące użytkowania i najlepsze praktyki
Używaj BullBear Dynamics w połączeniu z innymi narzędziami (filtry trendu, wsparcie/opór, analiza wzorców) dla potwierdzenia.
Bądź ostrożny interpretując sygnały podczas okresów niskiej zmienności, gdy słupki histogramu pozostają w granicach progów.
Priorytetowo traktuj sygnały, gdy histogram przecina linię sygnału i przebija progi.
Potwierdzaj zgodność kierunku na wyższych interwałach czasowych przed działaniem na sygnałach z niższych interwałów.
Dostosuj parametry (długości EMA, mnożnik progów, okno StdDev) w zależności od potrzeb, aby dopasować do różnych rynków (Forex, indeksy, surowce, kryptowaluty).
Kluczowe cechy i wyróżniki
Normalizacja adaptująca się do zmienności — momentum jest skalowane przez ATR, dzięki czemu sygnały są bardziej wiarygodne w różnych warunkach rynkowych.
Dynamiczne progi — oparte na kroczącym odchyleniu standardowym, dostosowują się do panujących warunków rynkowych, pomagając zmniejszyć fałszywe przebicia.
Wyraźny wielokolorowy histogram — wizualne rozróżnienie między silnym a słabym momentum oraz byczym a niedźwiedzim.
Szeroka kompatybilność — działa na wszystkich instrumentach i interwałach czasowych obsługiwanych przez cTrader.
Darmowy w użyciu — dostępny bez opłat; idealny dla traderów chcących zaawansowanych funkcji wskaźnika bez subskrypcji.
Podsumowanie
The output is displayed as a multi-color histogram with green bars indicating bullish momentum and red bars indicating bearish momentum. The intensity of the colors reflects the strength of the momentum relative to dynamically calculated upper and lower thresholds. The signal line serves as a baseline to identify potential momentum shifts when the histogram crosses it. Threshold lines mark zones of significant momentum moves, with bars crossing these lines signaling stronger trends.
BullBear Dynamics supports all instruments and timeframes available on cTrader, including Forex, commodities, indices, and cryptocurrencies. It is recommended to use this indicator alongside other analysis tools for confirmation and to adjust its parameters to fit different market conditions and trading styles such as scalping.
Opinie klientów
5 | 100 % | |
4 | 0 % | |
3 | 0 % | |
2 | 0 % | |
1 | 0 % |


