
Penerangan
Indeks Tekanan Lilin (CPI) adalah penunjuk yang kuat namun mudah digunakan yang direka untuk mendedahkan tekanan beli dan jual tersembunyi di sebalik setiap lilin. Daripada hanya menunjukkan sama ada harga bergerak naik atau turun, CPI menyelami lebih dalam bagaimana kuatnya pembeli atau penjual mengawal pasaran dalam setiap lilin. Ini menjadikannya alat unik untuk mengenal pasti kekuatan tren, mengesan pembalikan awal, dan mengesahkan titik masuk atau keluar dengan ketepatan yang lebih tinggi.
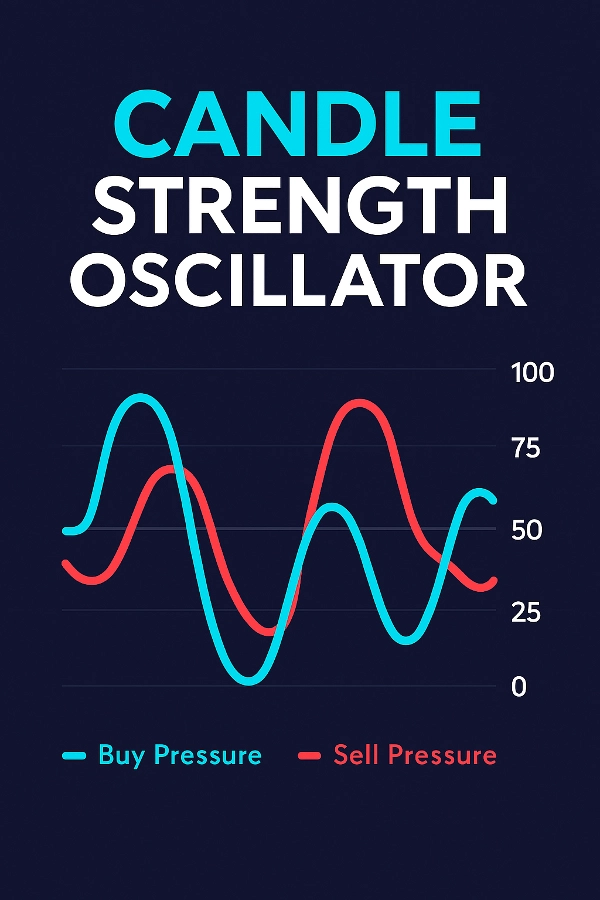
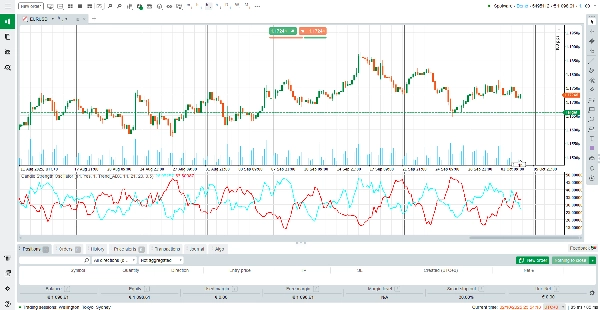
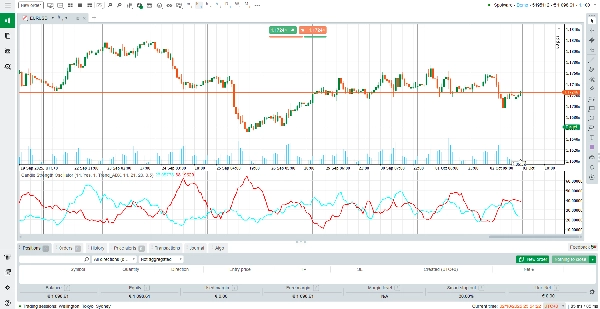
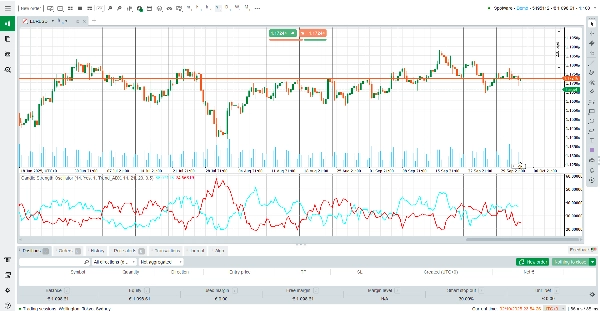
Berbeza dengan osilator tradisional yang hanya bertindak balas terhadap harga, CPI menggabungkan dinamik badan lilin, momentum, pemberatan volum, dan analisis tren (ADX atau EMA) untuk memberi anda pandangan menyeluruh tentang tekanan pasaran. Dengan dua garis licin – Tekanan Beli (sian) dan Tekanan Jual (merah) – pedagang boleh segera melihat pihak mana dalam pasaran yang mengawal.
Cara Membaca Penunjuk
Tekanan Beli (Garis Sian) – Mewakili intensiti kawalan bullish. Garis yang menaik menunjukkan dominasi pembeli yang meningkat.
Tekanan Jual (Garis Merah) – Mewakili intensiti kawalan bearish. Garis yang menaik menunjukkan kekuatan jualan yang lebih kuat.
Persilangan – Apabila garis Beli melintasi di atas garis Jual, ia menandakan tekanan bullish yang lebih kuat (peluang membeli berpotensi). Apabila garis Jual melintasi di atas, tekanan bearish menguasai (peluang menjual berpotensi).
Zon Tahap 50 – Bacaan sekitar tengah (≈50) menunjukkan keseimbangan antara pembeli dan penjual, manakala bacaan ekstrem (di atas 75 atau di bawah 25) menunjukkan tekanan arah yang kuat.
Peningkatan Faktor Tren – Penunjuk menyesuaikan isyaratnya berdasarkan pengesahan tren dari ADX atau cerun EMA, mengurangkan isyarat palsu semasa pasaran mendatar.
Cara Penunjuk Berfungsi
CPI mengira tekanan menggunakan model pemberatan yang mengambil kira:
Struktur lilin: Saiz badan dan posisi penutupan berbanding tinggi/rendah.
Momentum: Pergerakan harga berbanding lilin sebelumnya.
Volum: Pemberatan volum tick memastikan pergerakan volum tinggi membawa lebih banyak kepentingan.
Pengesahan tren: Sama ada kekuatan ADX atau cerun EMA menambah faktor peningkatan untuk menyelaraskan isyarat dengan tren semasa.
Pelancaran: Penapis SMA yang ditentukan pengguna memastikan garis yang licin dan stabil tanpa kehilangan kepekaan.
Formula canggih ini bermakna CPI bukan sahaja bertindak balas kepada harga, tetapi juga memahami mengapa harga bergerak – memberi pedagang pandangan lebih mendalam tentang tingkah laku pasaran.
Ciri-ciri Utama
Visualisasi Dua Garis – Bandingkan tekanan beli vs jual dengan segera menggunakan garis berwarna (sian untuk pembeli, merah untuk penjual).
Peningkatan Tren Adaptif – Mengintegrasikan ADX atau EMA untuk mengesahkan arah tren dan mengurangkan isyarat palsu.
Pengiraan Berasaskan Volum – Diberatkan oleh volum tick untuk menyerlahkan pergerakan yang disokong oleh penyertaan pasaran sebenar.
Paparan Licin & Bersih – Penapis SMA terbina dalam untuk bacaan licin tanpa gangguan lag.
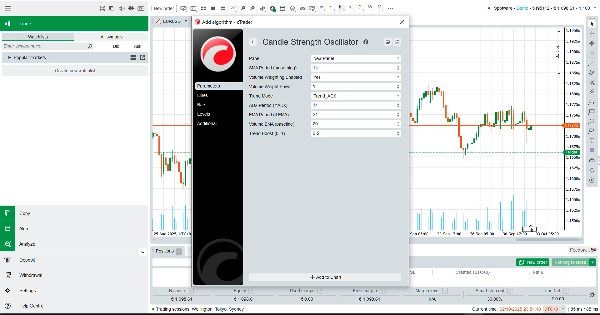
Sepenuhnya Boleh Disesuaikan – Tempoh, pemberatan, dan intensiti peningkatan yang boleh laras untuk menyesuaikan dengan gaya perdagangan apa pun.
Mengapa Menggunakan Indeks Tekanan Lilin?
CPI sangat sesuai untuk pedagang yang ingin melangkaui tindakan harga mudah dan melihat pertarungan sebenar antara pembeli dan penjual. Sama ada anda seorang scalper, pedagang ayunan, atau pengikut tren, penunjuk percuma ini memberi anda kejelasan yang diperlukan untuk menentukan masa masuk, mengurus risiko, dan kekal selaras dengan arah sebenar pasaran.
Muat turun Indeks Tekanan Lilin (CPI) hari ini – dan berdagang dengan yakin dengan memahami kekuatan tersembunyi yang menggerakkan setiap lilin.
Ringkasan
The indicator displays two smooth lines: Buy Pressure (cyan) and Sell Pressure (red). Crossovers between these lines signal shifts in market dominance, helping traders identify trend strength, potential reversals, and optimal entry or exit points. Readings near the midpoint indicate balance, while extremes suggest strong directional pressure.
CPI incorporates volume-weighted calculations and trend-based boosts to reduce false signals during sideways markets. It includes a smoothing filter for stable, responsive readings and offers customization of periods, weighting, and trend boost intensity.
This tool is applicable across various markets including Forex, commodities, stocks, and cryptocurrencies, supporting trading strategies such as scalping and breakout trading. It aims to provide traders with enhanced insight into market dynamics beyond simple price action.
Ulasan pelanggan
5 | 0 % | |
4 | 100 % | |
3 | 0 % | |
2 | 0 % | |
1 | 0 % |


![Logo "[Hamster-Coder] Moving Average MTF"](https://cdn.ctrader.com/image/webp/b11b98b1-194d-4b8e-b00e-d611826ad159_31226)


