
High TF Plotter
Indikator
441 muat turun
Versi 1.0, May 2025
Windows, Mac
4.6
Ulasan: 3
Penerangan
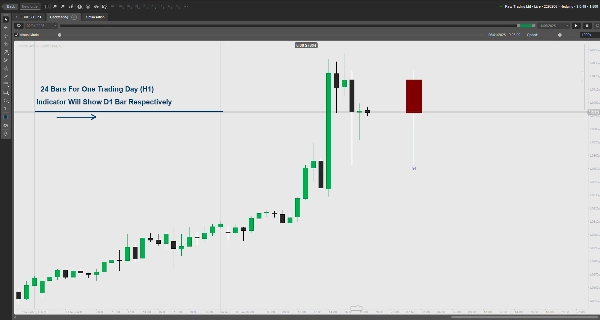
Memaparkan tindakan harga TF tinggi pada carta TF rendah. Menunjukkan buka/tutup, sumbu, dan zon utama dengan warna bull/bear. Boleh disesuaikan.
Ciri-ciri Utama:
- Menyelaputi tindakan harga jangka masa tinggi (contohnya, Harian) pada carta jangka masa rendah.
- Memaparkan segi empat harga buka/tutup dengan warna bull/bear yang boleh disesuaikan.
- Menonjolkan zon premium/diskaun sumbu untuk tahap harga utama.
- Margin boleh dikonfigurasikan untuk jarak carta.
- Pengendalian ralat untuk tetapan jangka masa yang tidak sah.
Sila tinggalkan ulasan untuk memberitahu kami jika ia membantu.
Ringkasan
Ringkasan AI
High TF Plotter is a trading indicator that overlays high timeframe price action onto lower timeframe charts. It visually represents open and close prices using customizable bull and bear colored rectangles. The tool highlights wick premium and discount zones to mark key price levels, aiding in the identification of significant market areas. Users can adjust chart spacing through a configurable margin setting. The indicator includes error handling for invalid timeframe inputs, ensuring reliable operation. This functionality supports analysis by combining broader timeframe context with detailed lower timeframe data.
Profil indikator
Ulasan pelanggan
4.6
Ulasan: 3
5 | 67 % | |
4 | 33 % | |
3 | 0 % | |
2 | 0 % | |
1 | 0 % |
Ulasan pelanggan
January 27, 2026
It would have been very helpful if it were possible to configure the time for NY EST
August 18, 2025
Clear higher timeframe level plotting, customizable, lightweight. Cons: No auto-labels, no multi-timeframe overlays, no alerts.
May 29, 2025
Muito bom, mas se tivesse a linha de abertura, máxima e mínima seria perfeito. Obrigada.
Perbincangan
Soalan Lazim
Produk yang tersedia melalui cTrader Store, termasuk bot dagangan, indikator dan plugin, disediakan oleh pembangun pihak ketiga dan diberikan akses untuk tujuan maklumat dan teknikal sahaja. cTrader Store bukan broker dan tidak memberikan nasihat pelaburan, syor peribadi atau sebarang jaminan prestasi masa hadapan.
Lebih banyak produk daripada penulis ini


![Logo "[Stellar Strategies] Market Session Ultimate"](https://cdn.ctrader.com/image/webp/61ffd537-0125-4246-9e72-42eca1791d64_28232)

![Logo "[Stellar Strategies] Smart ADX"](https://cdn.ctrader.com/image/webp/af13b084-b6f6-41db-b7bc-c7e688b57b05_36929)


Harga
86.67M
Volum yang didagangkan
1.99M
Pip dimenangi
3.67K
Pemasangan percuma