
Head Shoulders Finder
Indikator
445 muat turun
Versi 1.0, May 2025
Windows, Mac
5.0
Ulasan: 1
Penerangan
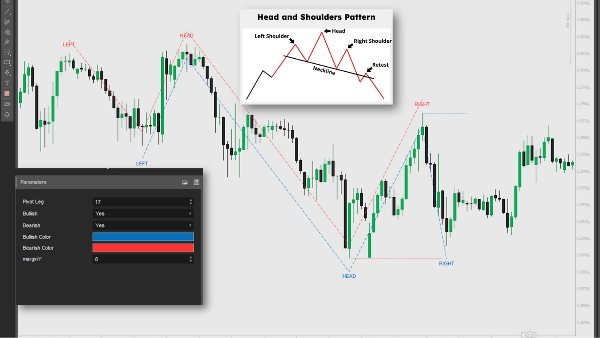
Penunjuk ini mengenal pasti corak Head and Shoulders dan Inverted Head and Shoulders dengan menganalisis puncak dan lembah pivot dalam data harga. Ia melukis garis, label, dan isyarat untuk kemungkinan pembalikan tren, mencetuskan keadaan jual pendek apabila harga melintasi di bawah garis leher (bearish) atau keadaan beli panjang apabila di atas (bullish). Pedagang boleh menggunakan isyarat ini untuk memasuki posisi jual pendek atau beli panjang, digabungkan dengan analisis lain dan pengurusan risiko untuk mengoptimumkan strategi perdagangan.
Ringkasan
Ringkasan AI
The Head Shoulders Finder is a technical indicator designed to detect Head and Shoulders and Inverted Head and Shoulders chart patterns by analyzing pivot highs and lows in price data. It visually marks these patterns with lines and labels on the price chart, highlighting potential trend reversal points. The indicator generates trading signals by identifying when the price crosses the neckline: a break below signals a bearish trend reversal suitable for short positions, while a break above indicates a bullish reversal for long positions. Traders can use these signals alongside other technical analyses and risk management strategies to inform entry decisions. This tool supports pattern recognition and signal plotting to assist in identifying potential trading opportunities based on classic reversal formations.
Profil indikator
Ulasan pelanggan
5.0
Ulasan: 1
5 | 100 % | |
4 | 0 % | |
3 | 0 % | |
2 | 0 % | |
1 | 0 % |
Ulasan pelanggan
August 18, 2025
Automatically detects Head & Shoulders patterns, customizable visuals. Cons: No pattern reliability filter, no alerts, false signals on low TFs.
Perbincangan
Soalan Lazim
Produk yang tersedia melalui cTrader Store, termasuk bot dagangan, indikator dan plugin, disediakan oleh pembangun pihak ketiga dan diberikan akses untuk tujuan maklumat dan teknikal sahaja. cTrader Store bukan broker dan tidak memberikan nasihat pelaburan, syor peribadi atau sebarang jaminan prestasi masa hadapan.
Lebih banyak produk daripada penulis ini


![Logo "[Stellar Strategies] Smart ADX"](https://cdn.ctrader.com/image/webp/af13b084-b6f6-41db-b7bc-c7e688b57b05_36929)


Harga
86.49M
Volum yang didagangkan
1.97M
Pip dimenangi
3.65K
Pemasangan percuma