
Opis
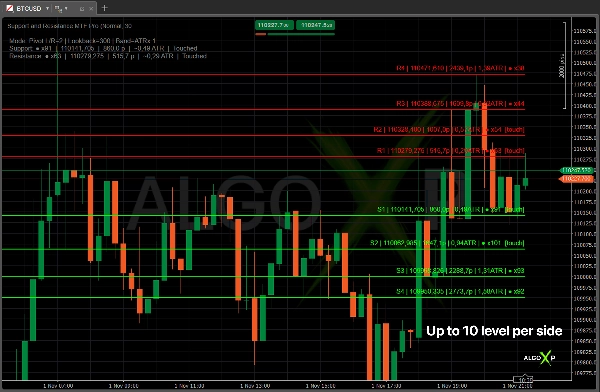
🎱Support and Resistance MTF Pro to zaawansowany wskaźnik wsparcia/oporu, który tworzy prawdziwe poziomy rynkowe na podstawie swingów (pivotów) szczytów/doliny.
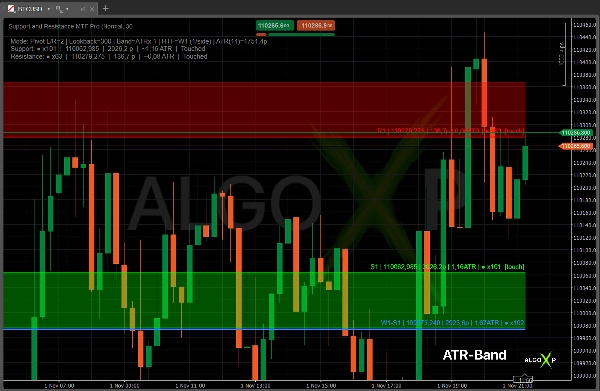
Automatycznie wykrywa poziomy swingów, łączy pobliskie ekstremy w strefy, klasyfikuje je według liczby dotknięć i ważonej siły, i wyświetla tylko najważniejsze strefy po obu stronach ceny. Strefy HTF/MTF oraz etykiety Pro zapewniają czystsze, szybsze decyzje - bez potrzeby ręcznego oznaczania. Opcjonalne pół-pasma ATR/stałe podkreślają tylko najbliższe wsparcie i opór, podczas gdy kompaktowy HUD pokazuje aktualny tryb i dokładne odległości do najbliższych poziomów w pipach oraz ~ATR.
Poznaj więcej zasobów i szczegółowe FAQ na AlgoXP
🚀 Dlaczego traderzy go wybierają
- Widzą tylko istotne poziomy. S/R bez szumów: strefy automatycznie się łączą i przechodzą filtr siły — twój wykres pokazuje to, co faktycznie utrzymuje cenę.
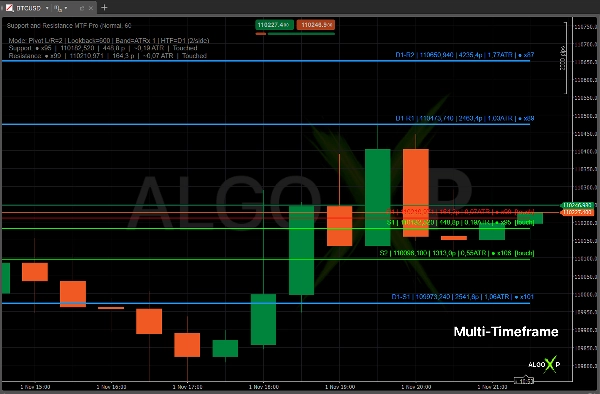
- Handlują z konfluencją wyższych TF. Strefy wyższych interwałów nakładają się na aktualny wykres z wyraźnym stylem — natychmiastowy kontekst „co jest dalej powyżej/poniżej”.
- Decydują szybciej, zarządzają ryzykiem ściślej. Pro etykiety po prawej pokazują cenę poziomu, odległość w pipach i ~ATR, liczbę dotknięć i status na żywo — bez linijki czy kalkulatora.
- Wykrywają wejścia na pierwszy rzut oka. Miękkie pół-pasma rysują tylko na najbliższym wsparciu i oporze — zobacz, gdzie odpuszczać lub przebijać bez bałaganu.
- Skup się, nie bądź zajęty. Top-N stref na stronę, kompaktowy HUD i automatyczne czyszczenie — czysty ekran, mniej decyzji na minutę.
⚡Kluczowe funkcje
- Silnik Swing-to-Zone: pivoty → zgrupowane ekstrema → strefy z mid/half; tolerancja łączenia skalowana ATR.
- Ranking siły: surowe i ważone dotknięcia z zanikiem (półokresem) i wygasaniem — żywa „siła poziomu”, a nie jednorazowy znak.
- Wsparcie MTF (M1…W1): limity po stronie, dedykowany kolor; strefy HTF ładnie scalone z LTF.
- Etykiety Pro: cena poziomu, odległość w pipach i ~ATR, ● xN dotknięć, statusy na żywo: przebicie / retest / flip / dotknięcie.
- Najbliższe pasma (ATR/stałe): półszerokość z czynnika ATR lub stałych pipów; stosowane tylko do najbliższego wsparcia i oporu.
- Dokładne odległości FX: wybierz Bid lub Ask jako odniesienie.
- Zoptymalizowany pod kątem wydajności: swingi HTF przeliczane tylko przy zamknięciu świecy HTF; obiekty wykresu automatycznie czyszczone co tick.
✨Dlaczego wygrywa w porównaniu z typowymi narzędziami S/R
- To nie tylko „rysowanie linii” — klasyfikuje i filtruje słabe strefy → mniej linii, wyższa jakość sygnału.
- Konfluencja HTF bez ręcznego oznaczania — natychmiastowa odpowiedź, co ogranicza lub wspiera cenę z góry/dół.
- Decyzje w sekundę: wszystkie kluczowe liczby są na etykiecie — bez mierzenia, bez zgadywania.
💸 Cena startowa: 15$ tylko dla pierwszych 3 kupujących. Po tym cena rośnie co 3 sprzedaże w progach aż do 70$.
🟢 🎱 🔴 🎱 🟢 🎱 🔴 🎱 🟢 🎱 🔴 🎱 🟢 🎱 🔴
Podsumowanie
Key features include a Swing-to-Zone engine with ATR-scaled merge tolerance, Pro labels displaying exact level prices, distances in pips and approximate ATR, touch counts, and live status indicators (break, retest, flip, touch). Nearest support and resistance bands are highlighted using ATR or fixed half-widths, focusing attention on the most relevant zones. The tool supports FX-accurate distance calculations referencing bid or ask prices and optimizes performance by recalculating higher timeframe swings only on bar close with automatic chart object cleanup.
Designed for markets including Forex, Crypto, and indices such as BTCUSD, EURUSD, XAUUSD, and NAS100, this indicator aims to reduce chart clutter by filtering weaker zones and improving decision speed and risk management through clear visual cues and a compact HUD showing current mode and distances to key levels.
Opinie klientów
5 | 33 % | |
4 | 67 % | |
3 | 0 % | |
2 | 0 % | |
1 | 0 % |


