
FairValueGap
อินดิเคเตอร์
2.1K ดาวน์โหลด
เวอร์ชัน 1.0, Apr 2025
Windows, Mac
4.5
รีวิว: 2
คำอธิบาย
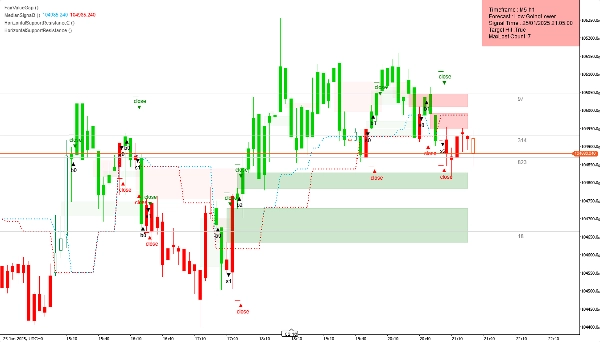
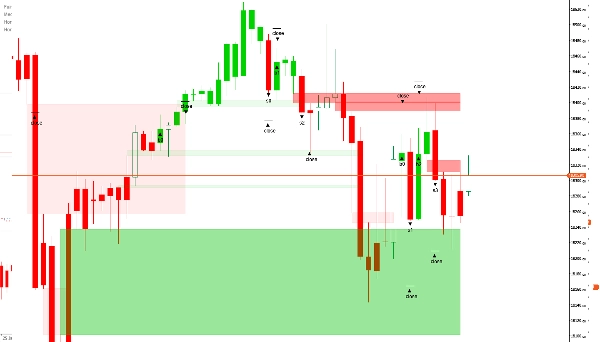
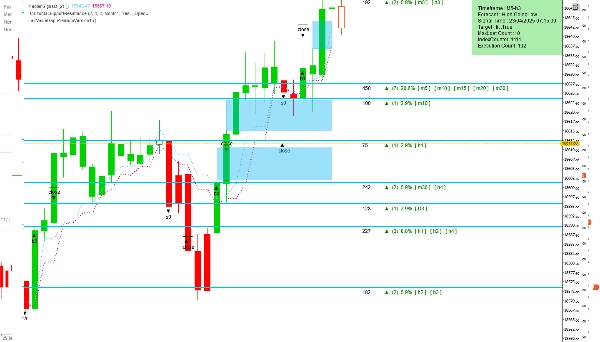
ตัวบ่งชี้ Fair Value Gap (FVG) เป็นเครื่องมือวิเคราะห์ทางเทคนิคที่ออกแบบมาเพื่อระบุความไม่สมดุลของราคาที่อาจเกิดขึ้นในตลาด ช่องว่างเหล่านี้เกิดขึ้นเมื่อราคาขยับอย่างรวดเร็ว สร้างโซนที่มีกิจกรรมการซื้อขายน้อย—ซึ่งมักเรียกว่า "ช่องว่าง" ความไม่สมดุลดังกล่าวอาจบ่งชี้ถึงความเป็นไปได้ของการย้อนกลับของราคา เนื่องจากตลาดมักจะพยายามหาสมดุลโดยการกลับไปยังพื้นที่เหล่านี้
ภาพรวมการตั้งค่า
- Bars To Load: กำหนดจำนวนแท่งประวัติศาสตร์ที่จะวิเคราะห์ เริ่มจากแท่งที่เพิ่งเสร็จสิ้นล่าสุดแล้วย้อนกลับไป
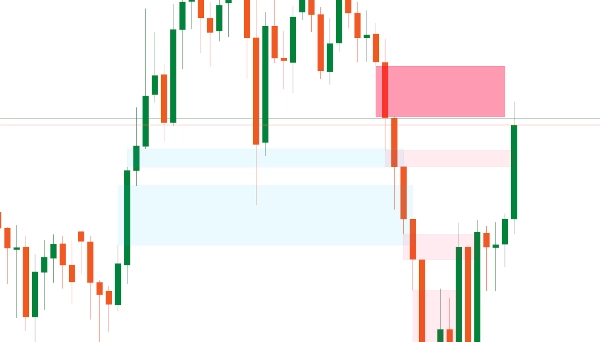
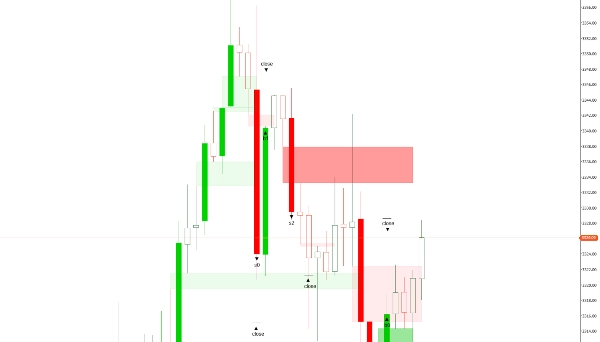
- Bullish FVG Color: กำหนดสีสำหรับ FVG ที่ปรากฏในแนวโน้มขาขึ้น โดยมีความโปร่งใส 30% เพื่อให้เห็นองค์ประกอบด้านหลังช่องว่างได้
- Bearish FVG Color: กำหนดสีสำหรับ FVG ที่ปรากฏในแนวโน้มขาลง โดยมีความโปร่งใส 30% เพื่อความชัดเจนของกราฟ
ฟีเจอร์พรีเมียม (มีในเวอร์ชันที่ชำระเงิน)
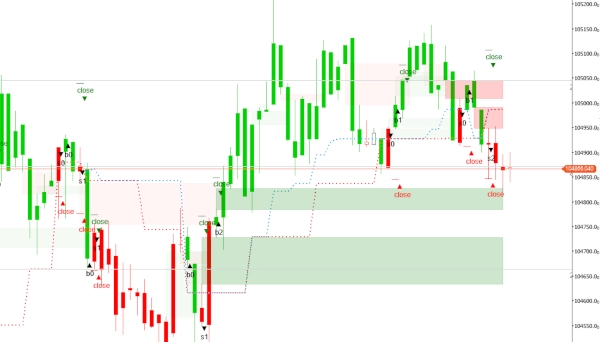
- Delete Closed Gaps: การตั้งค่าแบบบูลีน—เมื่อเปิดใช้งาน ("yes") จะลบช่องว่างที่ปิดทั้งหมดโดยอัตโนมัติ; หากปิดใช้งาน ("no") ช่องว่างจะยังคงมองเห็นได้ ซึ่งมีประโยชน์อย่างยิ่งในกรอบเวลาที่ต่ำกว่า 20 นาที
- Edit/Remove Gaps: อนุญาตให้เทรดเดอร์ปรับหรือ ลบช่องว่างด้วยตนเอง ซึ่งช่วยให้เทรดเดอร์ที่มีประสบการณ์ควบคุมได้มากขึ้น โดยเฉพาะอย่างยิ่งเนื่องจากช่องว่างขนาดเล็กมักมีอิทธิพลต่อการเคลื่อนไหวของราคาน้อย
- Set Timeframe: มีสองตัวเลือก—ใช้กรอบเวลาปัจจุบันของกราฟหรือเลือกกรอบเวลาอื่นสำหรับการวิเคราะห์ ในขณะที่ยังแสดงผลลัพธ์บนกราฟหลัก ฟีเจอร์นี้ช่วยให้เทรดเดอร์ได้รับข้อมูลเชิงลึกเกี่ยวกับการเคลื่อนไหวของตลาดได้รวดเร็วยิ่งขึ้น
- Selected Timeframe: กำหนดกรอบเวลาที่ต้องการสำหรับการวิเคราะห์ หากเลือก "Selected Timeframe" ในการตั้งค่าข้างต้น
- Small Gap Accuracy: ให้เทรดเดอร์ป้อนขนาดช่องว่างที่ต้องการเป็นจำนวนเต็ม ช่วยให้ระบุช่องว่างที่ในอดีตนำไปสู่ผลลัพธ์ที่ดี ค่าอิงตามชุดข้อมูลทั้งหมดและขนาดช่องว่างที่สังเกตได้สำหรับสินทรัพย์นั้น
โดยค่าเริ่มต้น ตัวบ่งชี้จะสแกนความไม่สมดุลทั้งหมดภายในกรอบเวลาเดียว อย่างไรก็ตาม การเข้าถึงฟีเจอร์พรีเมียมผ่านเวอร์ชัน FairValueGapPremium สามารถเพิ่มขีดความสามารถในการวิเคราะห์ได้อย่างมาก
สรุป
สรุปโดย AI
The Fair Value Gap (FVG) indicator is a technical analysis tool that identifies potential price imbalances in the market. These imbalances, or "gaps," occur when price moves rapidly, creating zones with minimal trading activity, often called "voids." Such areas may signal likely price retracements as the market tends to revisit these zones to restore balance.
Key settings include:
- Bars To Load: number of historical bars analyzed from the most recent backward.
- Bullish FVG Color: customizable color for gaps in uptrends with 30% transparency.
- Bearish FVG Color: customizable color for gaps in downtrends with 30% transparency.
Premium features (available in the paid version) enhance functionality by allowing:
- Automatic deletion of closed gaps, useful for lower timeframes.
- Manual editing or removal of gaps for finer control.
- Selection of analysis timeframe independent of the chart’s timeframe.
- Input of preferred gap size to improve identification accuracy based on historical data.
By default, the indicator scans imbalances within a single timeframe, with premium options providing expanded analytical capabilities.
โปรไฟล์อินดิเคเตอร์
รีวิวจากลูกค้า
4.5
รีวิว: 2
5 | 50 % | |
4 | 50 % | |
3 | 0 % | |
2 | 0 % | |
1 | 0 % |
รีวิวจากลูกค้า
August 12, 2025
Pros: Automatically highlights the first session FVG and extends it to session end. Clean, minimal interface ideal for intraday analysis. Cons: No alerts or tooltips. Cannot save templates or track past session gaps.
August 6, 2025
การสนทนา
คำถามที่พบบ่อย
ผลิตภัณฑ์ที่มีให้บริการผ่าน cTrader Store รวมถึงบอทการเทรด อินดิเคเตอร์ และปลั๊กอิน มีให้บริการโดยนักพัฒนาบุคคลที่สามและมีไว้เพื่อวัตถุประสงค์ในการเข้าถึงข้อมูลและทางเทคนิคเท่านั้น cTrader Store ไม่ใช่โบรกเกอร์และไม่ได้ให้คำแนะนำการลงทุน คำแนะนำส่วนบุคคล หรือการรับประกันผลการดำเนินงานในอนาคต


ราคา
ตั้งแต่ 19/04/2025
284.21M
ปริมาณการเทรด
1.08M
Pips ที่ได้กำไร
8
การขาย
3.39K
ติดตั้งฟรี