
Order Block Finder
지표
1.96K 다운로드
버전 1.0, May 2025
Windows, Mac
5.0
리뷰: 2
설명
"오더 블록 디텍터" 지표는 가격 차트에서 오더 블록(OB)을 찾아 표시하도록 설계되었습니다—대형 플레이어(기관)가 중요한 매수 또는 매도 주문을 배치하는 주요 구역으로, 종종 강한 가격 반응을 유발합니다. 이는 트레이더가 더 스마트한 거래 진입, 손절매 또는 이익 실현을 위한 잠재적 지지/저항 구역을 정확히 찾아내는 데 도움을 줍니다.
개념
- 오더 블록: 기관의 대량 주문 흐름으로 인해 시장이 반전하거나 일시 정지하는 가격 구역입니다. 이 지표는 거래량 피벗 고점과 시장 상태(강세/약세)를 분석하여 OB를 감지합니다.
- 작동 방식:
-
- 고점/저점을 조회 기간(Length)과 비교하여 시장 상태(강세/약세)를 결정합니다.
- 주요 가격 수준과 연관된 거래량 피크에서 OB를 식별합니다.
- OB를 표시하기 위해 사각형과 평균선을 그리며, 가격이 돌파할 때 완화된 OB를 확인하고 제거합니다.
- 사용 사례: 트레이더는 OB를 거래 설정, 리스크 관리 또는 이익 목표를 위한 높은 확률 구역으로 활용할 수 있습니다.
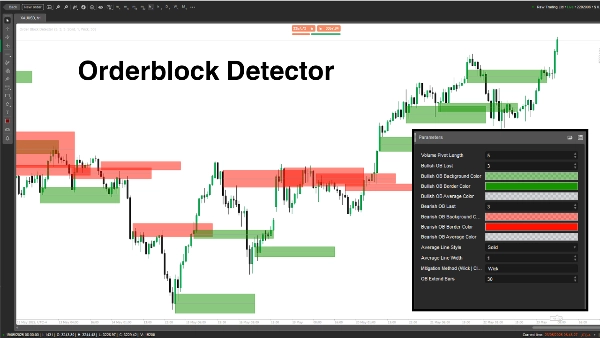
매개변수 세부사항
- 거래량 피벗 길이 (Length, 기본값: 5, 최소: 1)
-
- 기능: 고점/저점과 거래량 피벗 고점을 계산하기 위한 조회 기간(바 수)을 설정합니다.
- 중요성: 길이가 길수록 정확도가 높아지지만 OB 빈도가 줄어들고, 짧을수록 더 많은 OB를 포착하지만 노이즈가 포함될 수 있습니다.
- 강세 OB 마지막 (BullExtLast, 기본값: 3, 최소: 1)
-
- 기능: 저장 및 추적할 강세 OB의 수를 제한합니다.
- 중요성: 차트를 깔끔하게 유지하고 성능을 최적화하기 위해 표시되는 강세 OB 수를 제한합니다.
- 강세 OB 배경색 (BgBullCss, 기본값: #80169400)
-
- 기능: 강세 OB 사각형의 배경색과 투명도를 설정합니다.
- 중요성: 차트에서 강세 OB를 시각적으로 구분하는 데 도움을 줍니다.
- 강세 OB 테두리 색상 (BullCss, 기본값: #169400)
-
- 기능: 강세 OB 사각형의 테두리 색상을 정의합니다.
- 중요성: 강세 OB 구역의 가시성을 향상시킵니다.
- 강세 OB 평균 색상 (BullAvgCss, 기본값: #609598A1)
-
- 기능: 강세 OB 내 평균선의 색상을 지정합니다.
- 중요성: OB의 중간 지점을 표시하여 트레이더에게 중요한 참조 수준을 제공합니다.
- 약세 OB 마지막 (BearExtLast, 기본값: 3, 최소: 1)
-
- 기능: 저장 및 추적할 약세 OB의 수를 제한합니다.
- 중요성: BullExtLast와 마찬가지로 차트를 깔끔하게 유지하기 위해 약세 OB 수를 제한합니다.
- 약세 OB 배경색 (BgBearCss, 기본값: #80FF1100)
-
- 기능: 약세 OB 사각형의 배경색과 투명도를 설정합니다.
- 중요성: 약세 OB를 강세 OB와 구분합니다.
- 약세 OB 테두리 색상 (BearCss, 기본값: #FF1100)
-
- 기능: 약세 OB 사각형의 테두리 색상을 정의합니다.
- 중요성: 약세 OB를 빠르게 식별할 수 있도록 돋보이게 합니다.
- 약세 OB 평균 색상 (BearAvgCss, 기본값: #609598A1)
-
- 기능: 약세 OB 내 평균선의 색상을 지정합니다.
- 중요성: 거래 계획을 위한 약세 OB의 중심 가격 수준을 강조합니다.
- 평균선 스타일 (LineStyle, 기본값: Solid)
-
- 기능: OB 평균선의 스타일을 설정합니다 (실선, 점선, 점선).
- 중요성: 트레이더의 선호에 맞게 평균선의 모양을 맞춤 설정합니다.
- 평균선 두께 (LineWidth, 기본값: 1, 최소: 1)
-
- 기능: OB 평균선의 두께를 조절합니다.
- 중요성: 차트에서 평균선이 얼마나 두드러지게 보이는지 제어합니다.
- 완화 방법 (Mitigation, 기본값: "Wick")
-
- 기능: OB가 무효화되는 방식을 정의합니다:
-
- Wick: 완화를 확인하기 위해 최저가(강세 OB) 또는 최고가(약세 OB)를 사용합니다.
- Close: 완화를 확인하기 위해 종가를 사용합니다.
- 중요성: 가격이 OB 구역을 돌파하는 민감도에 영향을 미치며, OB가 제거되는 시점에 영향을 줍니다.
오더 블록 디텍터는 거래량 급증과 가격 움직임을 기반으로 기관 주문 구역을 포착하는 강력한 도구입니다. 명확한 OB 사각형과 평균선을 그리며 무효화된 OB는 동적으로 제거합니다. 트레이더는 매개변수를 조정하여 자신의 거래 스타일에 맞게 OB의 감지, 표시 및 관리를 세밀하게 조정할 수 있습니다.
요약
AI 요약
Order Block Finder is an indicator designed to identify and display Order Blocks (OBs) on price charts. Order Blocks represent key price zones where institutional traders place significant buy or sell orders, often causing notable price reactions. This tool helps traders locate potential support and resistance areas for improved trade entries, stop-loss placements, and take-profit targets.
The indicator works by analyzing volume pivot highs and determining market state (bullish or bearish) based on highs and lows over a configurable lookback period. It marks OBs with rectangles and average lines, dynamically removing those invalidated when price breaks through the zones. Users can customize parameters such as the lookback length, the number of bullish and bearish OBs tracked, colors and styles of OB rectangles and average lines, and the method used to detect OB mitigation (using wick or close prices).
This flexibility allows traders to tailor the detection and visualization of Order Blocks to their trading style, aiding in identifying high-probability zones for trade setups, risk management, and profit targeting.
지표 프로필
고객 리뷰
5.0
리뷰: 2
5 | 100 % | |
4 | 0 % | |
3 | 0 % | |
2 | 0 % | |
1 | 0 % |
고객 리뷰
December 18, 2025
THIS IS BY FAR THE BEST TOOL for OB's - as a beginner I can visually see where I am and Where I need to go - THANK YOU SO MUCH
August 12, 2025
Pros: Automatically identifies bullish and bearish order blocks based on swing breakouts with clear zones. Useful for visual SMC analysis. Cons: No alerts or tooltips. Lacks template saving and volume confirmation features. Slight delay under heavy chart load.
상담
자주 묻는 질문(FAQ)
트레이딩 봇, 지표, 플러그인 등 cTrader Store에서 제공되는 상품은 제3자 개발자에 의해 제공되며, 이는 단순히 정보 및 기술적 접근을 목적으로 제공된 것입니다. cTrader Store는 중개인이 아니며, 투자 조언, 개인별 추천 또는 향후 성과에 대한 어떠한 보장도 제공하지 않습니다.
이 작성자의 상품 더 보기


가격
86.62M
거래량
1.99M
핍 수익
3.65K
무료 설치