
High TF Plotter
インジケーター
435 ダウンロード数
バージョン 1.0、May 2025
Windows、Mac
4.6
レビュー: 3
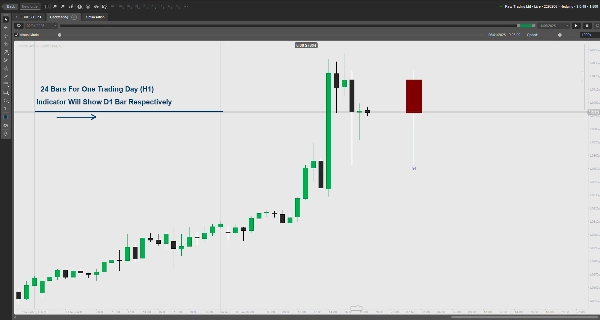
低い時間足のチャートに高い時間足の価格動向をプロットします。始値/終値、ヒゲ、重要なゾーンを強気/弱気の色で表示します。カスタマイズ可能です。
主な特徴:
- 高い時間足(例:日足)の価格動向を低い時間足のチャートに重ねて表示します。
- カスタマイズ可能な強気/弱気の色で始値/終値の価格矩形を表示します。
- 重要な価格レベルのヒゲのプレミアム/ディスカウントゾーンを強調表示します。
- チャートの間隔を設定可能なマージンで調整します。
- 無効な時間足設定に対するエラー処理。
役に立ったかどうか、レビューをお寄せください。
インジケーターのプロフィール
4.6
レビュー: 3
5 | 67 % | |
4 | 33 % | |
3 | 0 % | |
2 | 0 % | |
1 | 0 % |
カスタマーレビュー
January 27, 2026
It would have been very helpful if it were possible to configure the time for NY EST
August 18, 2025
Clear higher timeframe level plotting, customizable, lightweight. Cons: No auto-labels, no multi-timeframe overlays, no alerts.
May 29, 2025
Muito bom, mas se tivesse a linha de abertura, máxima e mínima seria perfeito. Obrigada.
cTrader Storeで入手可能な取引ボット、インジケーター、プラグインなどの商品は、第三者の開発者が提供するものであり、情報と技術の取得のみを目的としてご利用いただけます。cTrader Storeはブローカーではなく、投資助言や個人的な推奨を行うことも、将来のパフォーマンスを保証することもありません。
この作成者の他の商品


これも好きかも


86.17M
取引数量
1.91M
獲得pips
3.57K
無料インストール