
Head Shoulders Finder
Индикатор
445 скачивания
Версия 1.0, May 2025
Windows, Mac
5.0
Отзывы: 1
Описание
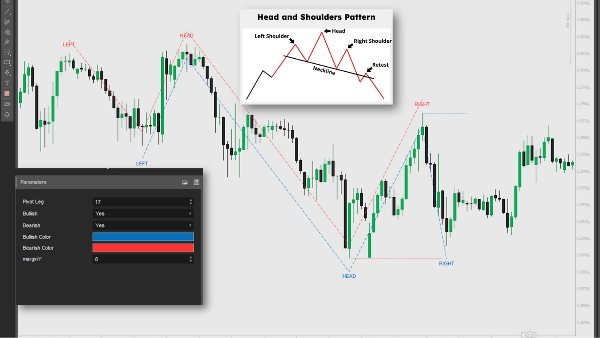
Этот индикатор определяет модели Голова и Плечи и Перевернутая Голова и Плечи, анализируя поворотные максимумы и минимумы в ценовых данных. Он строит линии, метки и сигналы для потенциальных разворотов тренда, инициируя короткие позиции при пересечении цены ниже линии шеи (медвежий сигнал) или длинные позиции при движении выше (бычий сигнал). Трейдеры могут использовать эти сигналы для входа в короткие или длинные позиции, сочетая их с другими анализами и управлением рисками для оптимизации торговых стратегий.
Сводка
ИИ-сводка
The Head Shoulders Finder is a technical indicator designed to detect Head and Shoulders and Inverted Head and Shoulders chart patterns by analyzing pivot highs and lows in price data. It visually marks these patterns with lines and labels on the price chart, highlighting potential trend reversal points. The indicator generates trading signals by identifying when the price crosses the neckline: a break below signals a bearish trend reversal suitable for short positions, while a break above indicates a bullish reversal for long positions. Traders can use these signals alongside other technical analyses and risk management strategies to inform entry decisions. This tool supports pattern recognition and signal plotting to assist in identifying potential trading opportunities based on classic reversal formations.
Профиль индикатора
Отзывы покупателей
5.0
Отзывы: 1
5 | 100 % | |
4 | 0 % | |
3 | 0 % | |
2 | 0 % | |
1 | 0 % |
Отзывы покупателей
August 18, 2025
Automatically detects Head & Shoulders patterns, customizable visuals. Cons: No pattern reliability filter, no alerts, false signals on low TFs.
Обсуждение
Частые вопросы
Продукты, доступные в cTrader Store, включая торговых ботов, индикаторы и плагины, предоставляются сторонними разработчиками и доступны исключительно в информационных и технических целях. cTrader Store не является брокером и не предоставляет инвестиционные консультации, персональные рекомендации или какие-либо гарантии будущей доходности.
Больше от этого автора


![Логотип продукта "Gaussian Channel [Iridio Capital]"](https://cdn.ctrader.com/image/webp/7c039209-5573-4a54-a072-f9528b503103_41960)


Цена
86.49M
Торгуемый объем
1.97M
Выигранные пипы
3.65K
Бесплатные установки