Mô tả
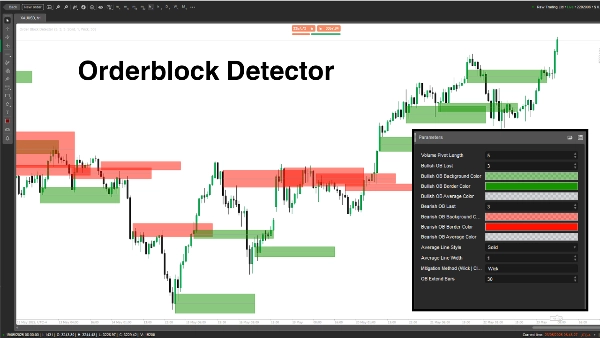
Chỉ báo "Order Block Detector" được xây dựng để phát hiện và hiển thị Order Blocks (OBs) trên biểu đồ giá — các vùng quan trọng nơi các nhà chơi lớn (các tổ chức) đặt các lệnh mua hoặc bán đáng kể, thường kích hoạt các phản ứng giá mạnh. Nó giúp các nhà giao dịch xác định các vùng hỗ trợ/kháng cự tiềm năng để vào lệnh, đặt dừng lỗ hoặc chốt lời thông minh hơn.
Khái niệm
- Order Blocks: Đây là các vùng giá mà thị trường đảo chiều hoặc tạm dừng do dòng lệnh lớn từ các tổ chức. Chỉ báo phát hiện OB bằng cách phân tích đỉnh pivot khối lượng và trạng thái thị trường (tăng/giảm).
- Cách hoạt động:
-
- Xác định trạng thái thị trường (tăng/giảm) bằng cách so sánh đỉnh/đáy với khoảng thời gian nhìn lại (Length).
- Xác định OB tại đỉnh khối lượng liên quan đến các mức giá quan trọng.
- Vẽ các hình chữ nhật và đường trung bình để đánh dấu OB, đồng thời kiểm tra và loại bỏ OB đã được giảm nhẹ khi giá phá vỡ.
- Trường hợp sử dụng: Các nhà giao dịch có thể sử dụng OB như các vùng có xác suất cao cho các thiết lập giao dịch, quản lý rủi ro hoặc mục tiêu lợi nhuận.
Phân tích tham số
- Độ dài Pivot Khối lượng (Length, Mặc định: 5, Tối thiểu: 1)
-
- Chức năng: Đặt khoảng thời gian nhìn lại (số thanh) để tính đỉnh/đáy và đỉnh pivot khối lượng.
- Tại sao quan trọng: Độ dài dài hơn tăng độ chính xác nhưng giảm tần suất OB; độ dài ngắn hơn bắt được nhiều OB hơn nhưng có thể bao gồm nhiễu.
- OB Tăng Cuối cùng (BullExtLast, Mặc định: 3, Tối thiểu: 1)
-
- Chức năng: Giới hạn số lượng OB tăng được lưu trữ và theo dõi.
- Tại sao quan trọng: Giới hạn số OB tăng hiển thị để giữ biểu đồ gọn gàng và tối ưu hiệu suất.
- Màu nền OB Tăng (BgBullCss, Mặc định: #80169400)
-
- Chức năng: Đặt màu nền và độ trong suốt của các hình chữ nhật OB tăng.
- Tại sao quan trọng: Giúp phân biệt trực quan các OB tăng trên biểu đồ.
- Màu viền OB Tăng (BullCss, Mặc định: #169400)
-
- Chức năng: Định nghĩa màu viền của các hình chữ nhật OB tăng.
- Tại sao quan trọng: Tăng cường khả năng nhìn thấy các vùng OB tăng.
- Màu trung bình OB Tăng (BullAvgCss, Mặc định: #609598A1)
-
- Chức năng: Tô màu đường trung bình bên trong các OB tăng.
- Tại sao quan trọng: Đánh dấu điểm giữa của OB, là mức tham chiếu quan trọng cho các nhà giao dịch.
- OB Giảm Cuối cùng (BearExtLast, Mặc định: 3, Tối thiểu: 1)
-
- Chức năng: Giới hạn số lượng OB giảm được lưu trữ và theo dõi.
- Tại sao quan trọng: Giống như BullExtLast, giữ cho biểu đồ không bị lộn xộn bằng cách giới hạn OB giảm.
- Màu nền OB Giảm (BgBearCss, Mặc định: #80FF1100)
-
- Chức năng: Đặt màu nền và độ trong suốt của các hình chữ nhật OB giảm.
- Tại sao quan trọng: Phân biệt OB giảm với OB tăng.
- Màu viền OB Giảm (BearCss, Mặc định: #FF1100)
-
- Chức năng: Định nghĩa màu viền của các hình chữ nhật OB giảm.
- Tại sao quan trọng: Làm cho OB giảm nổi bật để dễ nhận biết nhanh.
- Màu trung bình OB Giảm (BearAvgCss, Mặc định: #609598A1)
-
- Chức năng: Tô màu đường trung bình bên trong các OB giảm.
- Tại sao quan trọng: Làm nổi bật mức giá trung tâm của OB giảm để lập kế hoạch giao dịch.
- Kiểu đường trung bình (LineStyle, Mặc định: Solid)
-
- Chức năng: Đặt kiểu của đường trung bình OB (Solid, Dashed, Dotted).
- Tại sao quan trọng: Tùy chỉnh giao diện của đường trung bình phù hợp với sở thích của nhà giao dịch.
- Độ rộng đường trung bình (LineWidth, Mặc định: 1, Tối thiểu: 1)
-
- Chức năng: Điều chỉnh độ dày của đường trung bình OB.
- Tại sao quan trọng: Kiểm soát mức độ nổi bật của đường trung bình trên biểu đồ.
- Phương pháp giảm nhẹ (Mitigation, Mặc định: "Wick")
-
- Chức năng: Định nghĩa cách OB bị vô hiệu hóa:
-
- Wick: Sử dụng giá thấp nhất (OB tăng) hoặc giá cao nhất (OB giảm) để kiểm tra việc giảm nhẹ.
- Close: Sử dụng giá đóng cửa để kiểm tra việc giảm nhẹ.
- Tại sao quan trọng: Ảnh hưởng đến độ nhạy của chỉ báo khi giá phá vỡ vùng OB, tác động đến thời điểm OB bị loại bỏ.
Order Block Detector là một công cụ mạnh mẽ để phát hiện các vùng lệnh tổ chức dựa trên đỉnh khối lượng và hành động giá. Nó vẽ các hình chữ nhật OB rõ ràng với các đường trung bình và loại bỏ những OB không hợp lệ một cách động. Các nhà giao dịch có thể điều chỉnh các tham số để tinh chỉnh việc phát hiện, hiển thị và quản lý OB phù hợp với phong cách giao dịch của họ.
Tóm tắt
The indicator works by analyzing volume pivot highs and determining market state (bullish or bearish) based on highs and lows over a configurable lookback period. It marks OBs with rectangles and average lines, dynamically removing those invalidated when price breaks through the zones. Users can customize parameters such as the lookback length, the number of bullish and bearish OBs tracked, colors and styles of OB rectangles and average lines, and the method used to detect OB mitigation (using wick or close prices).
This flexibility allows traders to tailor the detection and visualization of Order Blocks to their trading style, aiding in identifying high-probability zones for trade setups, risk management, and profit targeting.
Đánh giá của khách hàng
5 | 100 % | |
4 | 0 % | |
3 | 0 % | |
2 | 0 % | |
1 | 0 % |