

TheVibe_NASDAQ_Liquidity_Cycles-v1.2.7
指标
版本 1.0, Mar 2026
Windows 版、Mac 版
4.2
评价:4

注册日期 05/02/2026
说明
TheVibe NASDAQ 流动性周期是一款专为纳斯达克100设计的专业级交易时段高亮工具。它无需手动跟踪时区差异或猜测成交量何时激增,而是将纽约市场的准确交易时间直观地呈现在您面前。
由于其逻辑基于绝对时间而非K线数量,该指标完全不受时间框架限制——无论您是在1分钟图上进行剥头皮交易,还是在1小时图上进行波段交易,它都能完美运行。
适用对象及使用方法: 该指标专为依赖精准时机和纯成交量驱动波动的日内交易者和动量交易者设计。
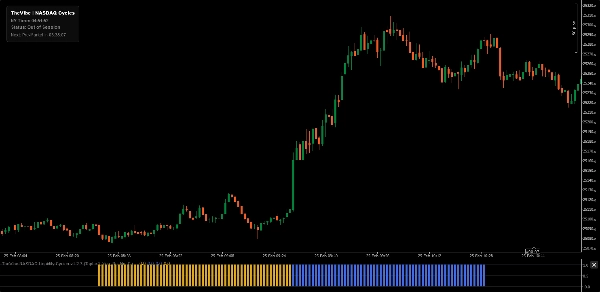
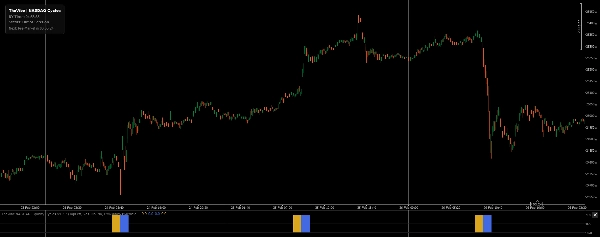
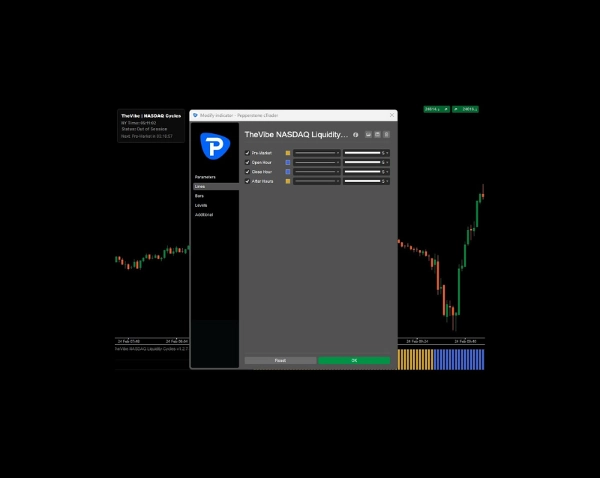
- 解读: 当关键流动性时段激活时,指标会在子窗口绘制实心、颜色编码的柱状图块。通过在屏幕上直观映射这些时间数据,您可以轻松将交易与高概率时段对齐,避免震荡且流动性低的时期,无需查看外部时钟。
跟踪的核心流动性阶段:
- 盘前时段(纽约时间上午8:30 - 9:30): 机构盘前时段,关注高影响力新闻和早期布局。
- 开盘时段(纽约时间上午9:30 - 10:30): 开盘钟声波动窗口,对初始价格发现和成交量激增至关重要。
- 收盘时段(纽约时间下午3:00 - 4:00): “强力时段”及收盘交叉,突出日终机构动量和头寸平仓。
- 盘后时段(纽约时间下午4:00 - 5:00): 盘后结算时段,捕捉标准交易结束时的最后流动性阶段。
主要功能:
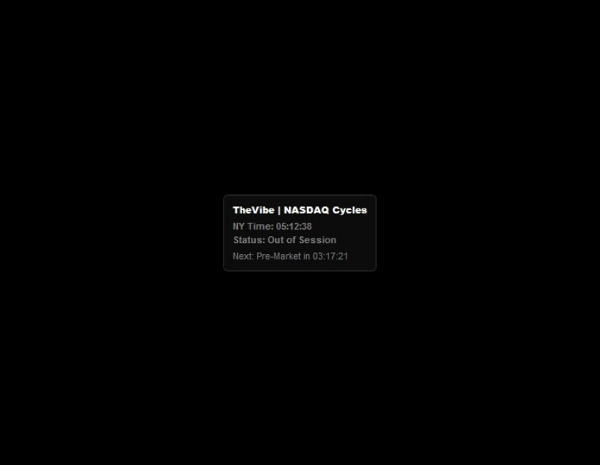
- 互动倒计时仪表盘: 一个动态的图表内HUD,显示准确的纽约时间、您当前的活跃时段,以及下一个流动性窗口的实时倒计时。
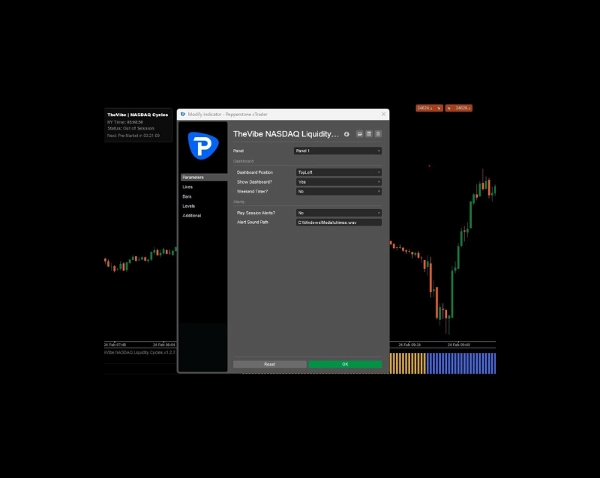
- 动态定位: 可将仪表盘固定在图表的任意四个角落(默认左下角),保持价格走势完全无遮挡。
- 高级时区引擎: 自动将您的本地或经纪服务器时间与准确的纽约时间同步(自动处理EST/EDT)。
- 智能周末逻辑: 可选择在周末隐藏倒计时,或显示直到周一盘前开盘的剩余天数和小时数。
- 音频提醒: 可选的通知铃声,在目标流动性窗口开启或关闭的准确时刻触发。
显示建议: 为了最佳的工作空间管理,请将指标的子窗口高度调整为紧凑尺寸。这为您提供了清晰且不干扰的“节奏条”,展示当天的流动性,同时最大限度地保留主价格图的屏幕空间。
注意:自动倒计时器假设标准的周一至周五交易时间,不会自动考虑美国公共假期或提前收市。
摘要
AI summary
TheVibe NASDAQ Liquidity Cycles is an indicator designed for the NASDAQ 100 that visually maps key liquidity sessions on trading charts using exact New York market time. It highlights four core liquidity phases: Pre-Market (8:30–9:30 AM NY), Open Hour (9:30–10:30 AM NY), Close Hour (3:00–4:00 PM NY), and After Hours (4:00–5:00 PM NY). The indicator plots color-coded histogram blocks in a sub-window to indicate active liquidity sessions, enabling traders to align their strategies with high-volume periods without manual time zone calculations.
This timeframe-agnostic tool works across all chart intervals, from 1-minute scalping to 1-hour swing trading. It features an interactive countdown dashboard displaying current New York time, active session, and time remaining until the next liquidity window. The dashboard can be positioned in any chart corner to avoid obstructing price data. An advanced timezone engine synchronizes local or broker server time with New York time, automatically adjusting for EST/EDT. Additional features include smart weekend logic to manage countdown display and optional audio alerts signaling session openings and closings.
The indicator is intended for day and momentum traders relying on volume-driven volatility and precise timing. For optimal use, it is recommended to keep the sub-window compact to maintain chart clarity.
This timeframe-agnostic tool works across all chart intervals, from 1-minute scalping to 1-hour swing trading. It features an interactive countdown dashboard displaying current New York time, active session, and time remaining until the next liquidity window. The dashboard can be positioned in any chart corner to avoid obstructing price data. An advanced timezone engine synchronizes local or broker server time with New York time, automatically adjusting for EST/EDT. Additional features include smart weekend logic to manage countdown display and optional audio alerts signaling session openings and closings.
The indicator is intended for day and momentum traders relying on volume-driven volatility and precise timing. For optimal use, it is recommended to keep the sub-window compact to maintain chart clarity.
指标配置
客户评价
4.2
评价:4
5 | 25 % | |
4 | 75 % | |
3 | 0 % | |
2 | 0 % | |
1 | 0 % |
客户评价
March 15, 2026
The workflow feels calmer, but it can look better than it is during a lucky run.
March 7, 2026
not bad if the rules are already clear, and It should not replace the chart.
March 3, 2026
the first impression improves when messy ideas reach the journal less often. Wrong inputs can break the setup.
讨论
常见问答
Signal
Breakout
Indices
NAS100
ATR
cTrader Store 提供的所有产品,包括交易机器人、指标和插件,均由第三方开发者提供,仅供信息参考和技术访问之用。cTrader Store 并非经纪商,不提供投资建议、个人推荐或任何未来业绩保证。















!["[Stellar Strategies] VBO" 标识](https://cdn.ctrader.com/image/webp/f034c012-94d4-445a-a01b-febd1cdedaef_36944)


价格
注册日期 05/02/2026