
Compare Symbol
Indikator
200 unduhan
Versi 1.0, May 2025
Windows, Mac
Deskripsi
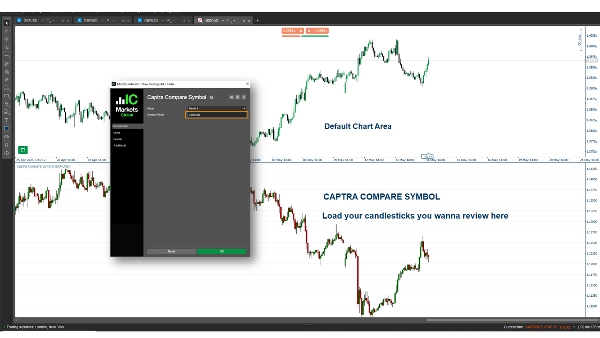
Captra Compare Symbol adalah indikator cTrader yang menampilkan harga penutupan dan menggambar candlestick (sumbu, badan) untuk simbol yang dipilih, seperti EURUSD, pada grafik. Ini mendukung berbagai kerangka waktu (misalnya, 5M, 15M, 1H, Harian) dengan visual yang dapat disesuaikan, menggunakan harga buka/tutup/tinggi/rendah untuk representasi yang akurat.
Ringkasan
Ringkasan AI
Captra Compare Symbol is a cTrader indicator that visualizes price data of a selected trading symbol, such as EURUSD, directly on the chart. It plots the close price and renders candlesticks—including wicks and bodies—using open, high, low, and close prices for precise representation. The indicator supports multiple timeframes, including 5-minute, 15-minute, 1-hour, and daily intervals. Visual elements are customizable to fit user preferences. This tool enables traders to compare the price action of an additional symbol alongside their primary chart, facilitating multi-symbol analysis within the cTrader platform.
Profil indikator
Ulasan pelanggan
0.0
Ulasan: 0
Ulasan pelanggan
Belum ada ulasan untuk produk ini. Sudah mencobanya? Jadilah pemberi ulasan pertama!
Diskusi
Pertanyaan umum
EURUSD
Produk-produk yang tersedia melalui cTrader Store, termasuk bot trading, indikator, dan plugin, disediakan oleh pengembang pihak ketiga serta hanya ditujukan untuk akses teknis dan informasi. cTrader Store bukan broker dan tidak menyediakan saran investasi, rekomendasi pribadi, atau jaminan apa pun tentang kinerja di masa mendatang.
Produk lain dari penulis ini


Harga
86.67M
Volume trading
1.99M
Pip dimenangkan
3.67K
Instal gratis