
High TF Plotter
Indikator
435 unduhan
Versi 1.0, May 2025
Windows, Mac
4.6
Ulasan: 3
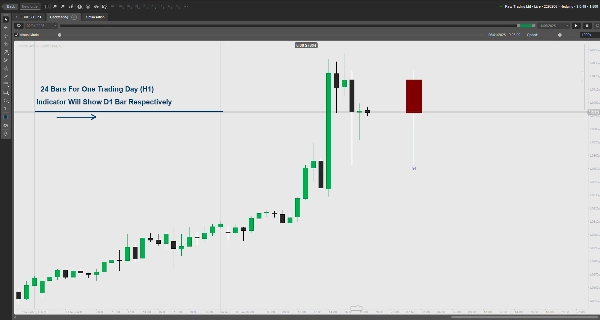
Menampilkan aksi harga TF tinggi pada grafik TF rendah. Menampilkan open/close, wick, dan zona kunci dengan warna bull/bear. Dapat disesuaikan.
Fitur Utama:
- Menimpa aksi harga timeframe tinggi (misalnya, Harian) pada grafik timeframe rendah.
- Menampilkan persegi harga open/close dengan warna bull/bear yang dapat disesuaikan.
- Menyoroti zona premium/diskon wick untuk level harga kunci.
- Margin yang dapat dikonfigurasi untuk jarak grafik.
- Penanganan kesalahan untuk pengaturan timeframe yang tidak valid.
Silakan tinggalkan ulasan untuk memberi tahu kami jika ini membantu.
Profil indikator
4.6
Ulasan: 3
5 | 67 % | |
4 | 33 % | |
3 | 0 % | |
2 | 0 % | |
1 | 0 % |
Ulasan pelanggan
January 27, 2026
It would have been very helpful if it were possible to configure the time for NY EST
August 18, 2025
Clear higher timeframe level plotting, customizable, lightweight. Cons: No auto-labels, no multi-timeframe overlays, no alerts.
May 29, 2025
Muito bom, mas se tivesse a linha de abertura, máxima e mínima seria perfeito. Obrigada.
Produk-produk yang tersedia melalui cTrader Store, termasuk bot trading, indikator, dan plugin, disediakan oleh pengembang pihak ketiga serta hanya ditujukan untuk akses teknis dan informasi. cTrader Store bukan broker dan tidak menyediakan saran investasi, rekomendasi pribadi, atau jaminan apa pun tentang kinerja di masa mendatang.
Produk lain dari penulis ini


86.17M
Volume trading
1.91M
Pip dimenangkan
3.57K
Instal gratis