
Head Shoulders Finder
Indikator
434 unduhan
Versi 1.0, May 2025
Windows, Mac
5.0
Ulasan: 1
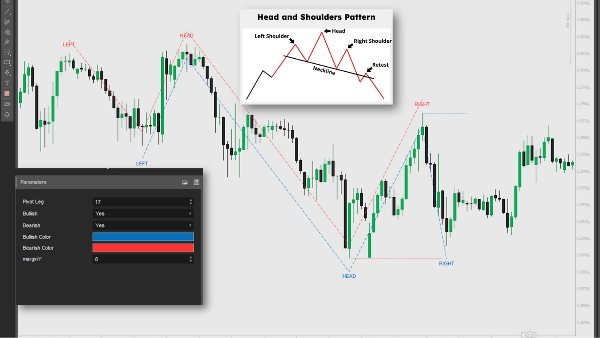
Indikator ini mengidentifikasi pola Head and Shoulders dan Inverted Head and Shoulders dengan menganalisis pivot tertinggi dan terendah dalam data harga. Ini menggambar garis, label, dan sinyal untuk potensi pembalikan tren, memicu kondisi short ketika harga menembus di bawah neckline (bearish) atau kondisi long ketika di atas (bullish). Pedagang dapat menggunakan sinyal ini untuk memasuki posisi short atau long, menggabungkannya dengan analisis lain dan manajemen risiko untuk mengoptimalkan strategi perdagangan.
Profil indikator
5.0
Ulasan: 1
5 | 100 % | |
4 | 0 % | |
3 | 0 % | |
2 | 0 % | |
1 | 0 % |
Ulasan pelanggan
August 18, 2025
Automatically detects Head & Shoulders patterns, customizable visuals. Cons: No pattern reliability filter, no alerts, false signals on low TFs.
Produk-produk yang tersedia melalui cTrader Store, termasuk bot trading, indikator, dan plugin, disediakan oleh pengembang pihak ketiga serta hanya ditujukan untuk akses teknis dan informasi. cTrader Store bukan broker dan tidak menyediakan saran investasi, rekomendasi pribadi, atau jaminan apa pun tentang kinerja di masa mendatang.
Produk lain dari penulis ini


86.17M
Volume trading
1.91M
Pip dimenangkan
3.57K
Instal gratis