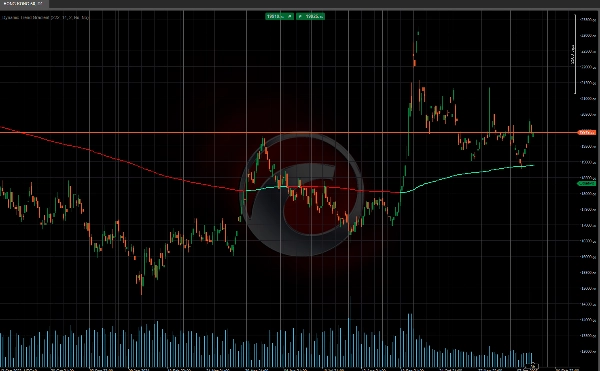
Indikator
RSI
Breakout
Signal
Supertrend
Dynamic Trend Gradient
Logo "Dynamic Trend Gradient"
03/09/2025
1
Desktop
SinceΒ 03/10/2024
Penjualan
102
Free installs
15435
Gambar unggahan "Dynamic Trend Gradient"

πŸ“ˆ This indicator is a tool that helps us identify and visualize the direction of the trend in a price chart. πŸ“Š Its operation is based on the calculation of trend levels using exponential moving averages and a measure of volatility to determine the zones where the price is expected to move. Below, I’ll explain in detail how it works:

πŸ“ Calculation of Trend Levels

The indicator starts by calculating what is called the "basis level." This level is obtained by averaging two exponential moving averages: one short-term (based on a user-defined length, in this case, 222) and one long-term (double the length of the first). These averages give us a reference for the overall trend.

Next, volatility is calculated using the standard deviation of the closing prices, and this value is smoothed with an additional exponential moving average. The smoothed volatility is multiplied by a parameter called "sensitivity," which gives us the upper and lower levels around the basis level. These levels act as trend bands and help identify whether the price is above or below the trend.

πŸ“‰πŸ“ˆ Trend Status

With these levels calculated, the indicator evaluates the trend status in the market. If the price is above the basis level, it assumes a bullish trend πŸ‚, and if it’s below, the trend is bearish πŸ». If the price crosses the upper or lower levels, the indicator changes its trend signal, indicating a possible reversal or shift in market momentum.

This tool is perfect for traders looking to stay ahead of market trends! πŸš€πŸ“‰πŸ“ˆ


Ctrader Store indicators:


Channel Breakout System

Fair Value Gap Sessions

 BOS & CHOCH

ZigZag

Supertrend

Market Imbalance

Adaptive Trend Channel 

Dynamic Market Structure
Analysis of Turning Points

Order Block

Fibonacci Linear
Regression Multi-timeframe

Volume POC Heatmap

Dynamic RSI

Momentum Fair Value Gap

Market Flow Projection

Dynamic Trend Gradient

Multi-Level Candle Bias
Tracker

Zig-Zag Extremity Tracker

Reactive Moving Average

Auto-Trend Channel

Auto Support and
Resistance Trend Lines

All Support and
Resistance Levels

Leverage Liquidation Map

Zones Supply Demand

Dynamic Range Momentum

Produk lain dari penulis ini
Peringkat teratas
Gratis
Indikator
RSI
Breakout
XAUUSD
+6
ZigZag
ZigZag filters noise, spots trends, patterns, pivots, aiding analysis, trade management, and confirmations. πŸ“‰πŸ“ˆ
Indikator
RSI
Breakout
XAUUSD
+6
Order Block
Identify bullish and bearish Order Blocks to spot key support/resistance levels and potential trend reversals! πŸ“ˆπŸ”„
Indikator
RSI
Breakout
XAUUSD
+5
Auto-Trend Channel
Adaptive trend channel using linear regression and Pearson correlation for dynamic support, resistance, and trends.
Indikator
RSI
XAUUSD
Breakout
+5
BOS & CHOCH
Market structural patterns , specifically the concepts of Change of Character (ChoCH) πŸ”„ and Break of Structure (BoS) πŸ’₯
Indikator
RSI
Breakout
XAUUSD
+5
Zones Supply Demand
πŸ“ŠZones Supply & Demand: Identifies key price levels with high volume concentration, marking Supply/Demand Zones & Marke
Indikator
RSI
Breakout
XAUUSD
+5
Supertrend
πŸ’Ή Define a price channel πŸ“ˆ and determine trend direction (bullish 🟒 or bearish πŸ”΄).
Indikator
RSI
Breakout
XAUUSD
+6
Volume POC Heatmap
πŸ“Š Shows volume by price levels, highlights POC, and key zones. Identifies dynamic support/resistance and imbalances.
Indikator
RSI
Breakout
Supertrend
All Support and Resistance Levels
"Identify key market zones and visualize support/resistance from multiple timeframes on a single chart.
Indikator
RSI
Breakout
XAUUSD
+6
Fair Value Gap Sessions
identify and highlight temporary market inefficiencies known as "fair value gaps" 🚨 within specific trading Sessions.
Indikator
RSI
Breakout
XAUUSD
+4
Dynamic Market Structure Analysis of Turning Points
Identify market structure effortlessly with swing highs, lows, CHoCH, and BOS levels for smart trading decisions! πŸ“ŠπŸ”"
Indikator
Indices
RSI
XAUUSD
+7
RSI Divergence
Detects bullish and bearish divergences
Indikator
RSI
Breakout
Supertrend
Trend Heikin Multi MA
πŸš€ TrendHeikinMultiMA: Advanced trend detection using Heikin-Ashi smoothing & MAs! Eliminates noise, confirms real trend
Indikator
RSI
Breakout
XAUUSD
+4
Multi-Level Candle Bias Tracker
Price direction by calculating the probability of reaching new highs/lows. Shows levels & statsπŸ“ˆ
Indikator
RSI
Breakout
Supertrend
Leverage Liquidation Map
πŸ“Š Liquidation Map: Potential areas where highly leveraged investors might face liquidations.
Indikator
RSI
Breakout
Supertrend
Market Trend OB
Price action to detect when the market changes trend (MSB) and defines, order blocks , ZigZag etc.πŸ“Š
Indikator
RSI
Breakout
Supertrend
Zig-Zag Extremity Tracker
Dynamically adjusts regression channels based on ZigZag extremes, resetting when price breaks bands to track real trends
Indikator
RSI
Breakout
Supertrend
+3
Fibonacci Linear Regression Multi-timeframe
Combining Fibonacci levels and regression to analyze multidimensional market trends across multiple timeframesΒ‘
Advanced Market Structure Bos,Choch,SwinLevels, Order Blog
Advanced price action toolΒ that combines multiple technical analysis concepts
Anda mungkin juga suka
Trend Direction Force Index - TDFI (Alerts)
Spot Strong Trends Early & Filter Market Noise
rvwap v1
Rolling VWAP with dynamic or fixed time window, customizable source price and standard deviation bands.
Pivot Points Clasic,FIBO,etc
All-in-one Pivot Indicator: set Classic, Fibo, Woodie, Camarilla, Demark methods, style levels & labels your way ;)
vpdi
VPDI (open, close, high and low with % of the previous day and price changes in % of the previous day's close)
Indikator
Breakout
BreakOut_Probability_Expo
Break Out Probability Experimental indicator. Credits for this indicator goes to Zeiierman !!!
Fisher_m11
Fisher Transform with smoothing. Spot reversals and cycles with precision. Great for any market, any timeframe.
Advanced Market Structure Bos,Choch,SwinLevels, Order Blog
Advanced price action toolΒ that combines multiple technical analysis concepts
Indikator
RSI
Breakout
XAUUSD
+5
Supertrend
πŸ’Ή Define a price channel πŸ“ˆ and determine trend direction (bullish 🟒 or bearish πŸ”΄).
Indikator
Indices
Commodities
Stocks
+2
SymbolTFOverlay
The SymbolTFOverlay display the current symbol and timeframe as a semi-transparent text overlay on the chart.
AlgoCorner 1-100 Moving Averages
Draw as many Moving Averages as you need from a simple indicator.
Time To Break Even Lite Version
This is the trial version of Time To Break Even, which help you time your trade entry.
Indikator
Breakout
ATR
LT_SmartSwings
Detects swing highs/lows, structure, breakouts, trend lines, and fibs β€” great for price action trading.
Supply Demand V1-Premium
Auto-detect supply & demand zones, remove broken levels, and trade smarter with real-time alerts. Precision made simple.
Indikator
Breakout
Forex
On Balance Volume
On Balance Volume (OBV) measures buying and selling pressure as a cumulative indicator.
Indikator
VWAP
Indices
RSI
+4
ProVWAP
Advanced Anchored VWAP for cTrader: volatility bands, real‑time alerts & customizable session resets.
BWMFI_Visual
BW_MFI Vizual colors bars
Indikator
Indices
Prop
Stocks
+5
New Way Sar - Free
The Parabolic SAR, or "Stop and Reverse," is a dynamic technical analysis tool
SmartBot-MCDX Indicator
MCDX is a powerful and innovative indicator.