
说明
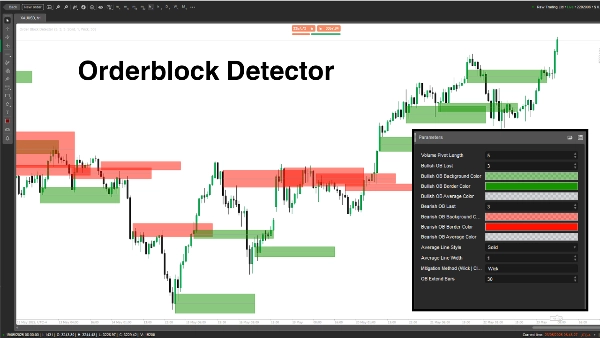
“订单区块检测器”指标旨在识别并显示订单区块(OB)在价格图表上——关键区域,大型参与者(机构)在此下达大量买卖订单,常常引发强烈的价格反应。它帮助交易者精准定位潜在的支撑/阻力区域,以实现更聪明的交易入场、止损或止盈。
概念
- 订单区块:这些是由于大量机构订单流导致市场反转或暂停的价格区域。该指标通过分析成交量枢轴高点和市场状态(看涨/看跌)来检测OB。
- 工作原理:
-
- 通过将高点/低点与回溯周期(长度)比较来确定市场状态(看涨/看跌)。
- 识别与关键价格水平相关联的成交量峰值处的OB。
- 绘制矩形和平均线以标记OB,同时检查并移除价格突破时的已缓解OB。
- 使用案例:交易者可以将OB用作高概率的交易设置、风险管理或利润目标区域。
参数解析
- 成交量枢轴长度(Length,默认:5,最小:1)
-
- 功能:设置用于计算高点/低点和成交量枢轴高点的回溯周期(柱数)。
- 重要性:较长的长度提高准确性但减少OB频率;较短的长度捕捉更多OB但可能包含噪音。
- 看涨OB数量限制(BullExtLast,默认:3,最小:1)
-
- 功能:限制存储和跟踪的看涨OB数量。
- 重要性:限制显示的看涨OB数量,保持图表整洁并优化性能。
- 看涨OB背景颜色(BgBullCss,默认:#80169400)
-
- 功能:设置看涨OB矩形的背景颜色和透明度。
- 重要性:帮助在图表上直观区分看涨OB。
- 看涨OB边框颜色(BullCss,默认:#169400)
-
- 功能:定义看涨OB矩形的边框颜色。
- 重要性:增强看涨OB区域的可见性。
- 看涨OB平均线颜色(BullAvgCss,默认:#609598A1)
-
- 功能:为看涨OB内的平均线着色。
- 重要性:标记OB的中点,作为交易者的重要参考水平。
- 看跌OB数量限制(BearExtLast,默认:3,最小:1)
-
- 功能:限制存储和跟踪的看跌OB数量。
- 重要性:与BullExtLast类似,通过限制看跌OB数量保持图表整洁。
- 看跌OB背景颜色(BgBearCss,默认:#80FF1100)
-
- 功能:设置看跌OB矩形的背景颜色和透明度。
- 重要性:区分看跌OB与看涨OB。
- 看跌OB边框颜色(BearCss,默认:#FF1100)
-
- 功能:定义看跌OB矩形的边框颜色。
- 重要性:使看跌OB突出,便于快速识别。
- 看跌OB平均线颜色(BearAvgCss,默认:#609598A1)
-
- 功能:为看跌OB内的平均线着色。
- 重要性:突出看跌OB的中心价格水平,便于交易规划。
- 平均线样式(LineStyle,默认:实线)
-
- 功能:设置OB平均线的样式(实线、虚线、点线)。
- 重要性:根据交易者偏好自定义平均线的外观。
- 平均线宽度(LineWidth,默认:1,最小:1)
-
- 功能:调整OB平均线的粗细。
- 重要性:控制平均线在图表上的显著程度。
- 缓解方法(Mitigation,默认:“Wick”)
-
- 功能:定义OB失效的判定方式:
-
- Wick:使用最低价(看涨OB)或最高价(看跌OB)检查缓解情况。
- Close:使用收盘价检查缓解情况。
- 重要性:影响指标对价格突破OB区域的敏感度,决定OB何时被移除。
订单区块检测器是一个基于成交量激增和价格行为识别机构订单区域的强大工具。它绘制清晰的OB矩形和平均线,并动态移除失效的OB。交易者可以调整参数,微调OB的检测、显示和管理,以匹配他们的交易风格。
摘要
AI 摘要
Order Block Finder is an indicator designed to identify and display Order Blocks (OBs) on price charts. Order Blocks represent key price zones where institutional traders place significant buy or sell orders, often causing notable price reactions. This tool helps traders locate potential support and resistance areas for improved trade entries, stop-loss placements, and take-profit targets.
The indicator works by analyzing volume pivot highs and determining market state (bullish or bearish) based on highs and lows over a configurable lookback period. It marks OBs with rectangles and average lines, dynamically removing those invalidated when price breaks through the zones. Users can customize parameters such as the lookback length, the number of bullish and bearish OBs tracked, colors and styles of OB rectangles and average lines, and the method used to detect OB mitigation (using wick or close prices).
This flexibility allows traders to tailor the detection and visualization of Order Blocks to their trading style, aiding in identifying high-probability zones for trade setups, risk management, and profit targeting.
指标配置
客户评价
5.0
评价:2
5 | 100 % | |
4 | 0 % | |
3 | 0 % | |
2 | 0 % | |
1 | 0 % |
客户评价
December 18, 2025
THIS IS BY FAR THE BEST TOOL for OB's - as a beginner I can visually see where I am and Where I need to go - THANK YOU SO MUCH
August 12, 2025
Pros: Automatically identifies bullish and bearish order blocks based on swing breakouts with clear zones. Useful for visual SMC analysis. Cons: No alerts or tooltips. Lacks template saving and volume confirmation features. Slight delay under heavy chart load.
讨论
常见问答
cTrader Store 提供的所有产品,包括交易机器人、指标和插件,均由第三方开发者提供,仅供信息参考和技术访问之用。cTrader Store 并非经纪商,不提供投资建议、个人推荐或任何未来业绩保证。
该作者的其他作品


价格
86.67M
交易量
1.99M
盈利点数
3.67K
免费安装