
Descripción
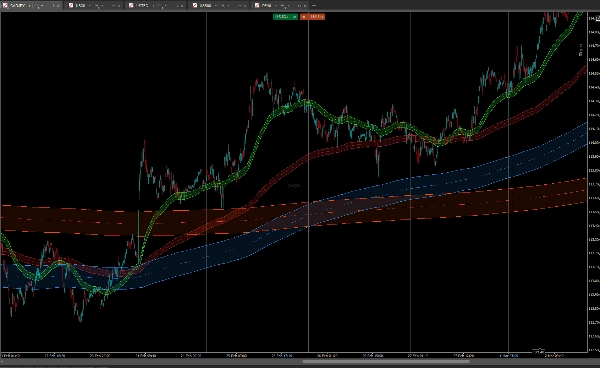
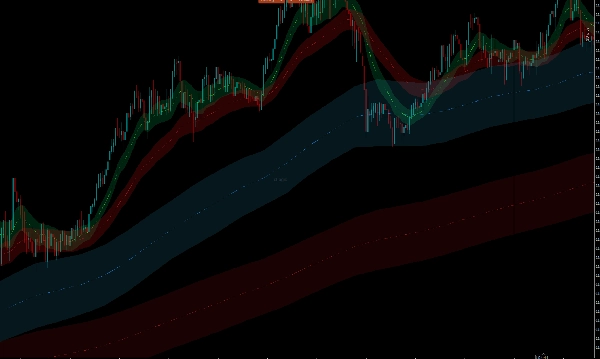
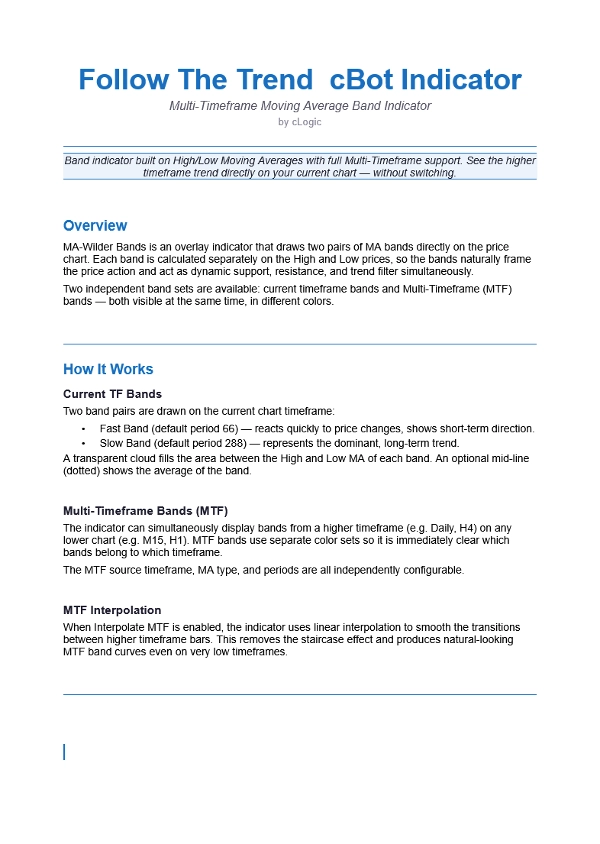
Follow The Trend es un indicador superpuesto que dibuja dos pares de bandas de Media Móvil en los precios Máximos y Mínimos — una Banda Rápida y una Banda Lenta — creando zonas dinámicas de soporte y resistencia que enmarcan naturalmente la acción del precio.
El soporte Multi-Timeframe te permite mostrar bandas de un marco temporal superior (por ejemplo, Diario, H4) directamente en tu gráfico actual sin cambiar. Las bandas MTF usan colores separados para que ambos marcos temporales sean siempre visibles de un vistazo.
La interpolación lineal suaviza las transiciones entre barras de marcos temporales superiores, eliminando el efecto escalera en marcos temporales inferiores.
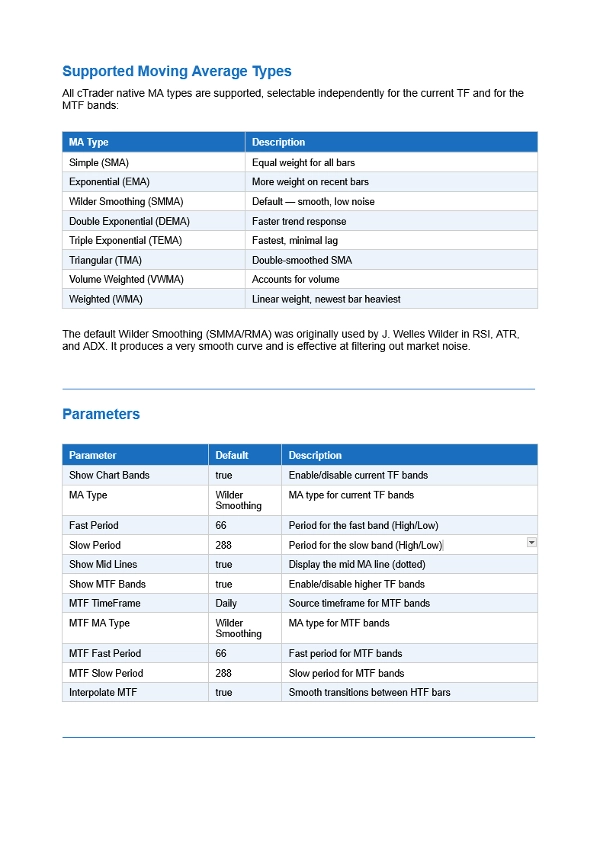
Se soportan los 8 tipos de MA de cTrader — Simple, Exponencial, Suavizado Wilder, Doble Exponencial, Triple Exponencial, Triangular, Ponderado por Volumen y Ponderado — seleccionables independientemente para las bandas del TF actual y MTF.
Cómo leerlo:
- Precio por encima de ambas bandas → tendencia alcista
- Precio por debajo de ambas bandas → tendencia bajista
- Precio dentro de las bandas → consolidación
- Aumento del espacio entre la banda Rápida y la banda Lenta → aceleración de la tendencia
Puedes encontrar este robot cBot aquí:
https://ctrader.com/products/3618?u=cLogic


![Logotipo de "[Hamster-Coder] Pivot Points MTF"](https://cdn.ctrader.com/image/webp/4c143e5a-309c-40e3-a578-f04d1e133ffa_31159)


