
Order Flow Ticks v2.0
Indikator
12.09K unduhan
Versi 1.1, Jan 2026
Windows, Mac
4.4
Ulasan: 23
Deskripsi
Deskripsi Terakhir -> 11/11/2025
Setiap aspek dari Order Flow Ticks (versi Teragregasi) dirancang dengan cermat dengan kinerja dalam pikiran, sehingga dapat berjalan bahkan di mesin kelas bawah.
Namun, berikut beberapa "Tips dan Trik" untuk penggunaan yang lebih baik:
- Data Tick disimpan di RAM, meskipun cTrader sudah memiliki manajemen memori yang baik:
-
- Muat hanya apa yang benar-benar dibutuhkan untuk trading langsung.
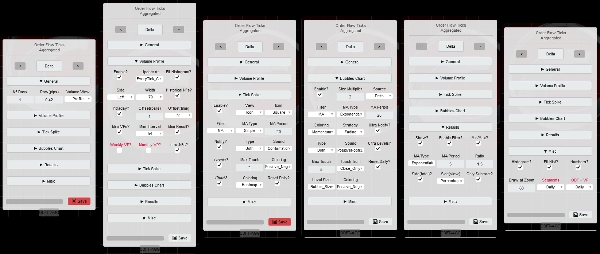
- Panel Parameter sudah menunjukkan parameter mana yang didukung oleh setiap mode.
- Interval Segmen dapat mengubah analisis filter, gunakan interval Harian untuk momentum Intraday.
- Pada Timeframe Lebih Tinggi (Termasuk Grafik Berbasis Harga)
-
- Atur ODF + VP ke Mingguan
- Nº hari / Reset Harian? parameter sekarang adalah Minggu/Mingguan.
- Semua filter akan direset setiap Minggu bukan setiap Hari.
- "Timeframe Lebih Rendah" dengan "Ukuran Baris Kecil":
-
- MA Kustom dibuat untuk mempercepat perhitungan ulang saat mengganti pengaturan di Panel Parameter.
- Jika Anda ingin tetap menggunakan Moving Averages cTrader, atur [ODF] Gunakan MA Kustom? ke Salah
-
- Bersabarlah jika ada Filter [Hasil / Spike / Bubbles] yang diaktifkan.
- Jika Performa Tinggi diperlukan:
-
- Nonaktifkan Volume Profile dan/atau gunakan Mini-VP sebagai gantinya. (default)
- Gunakan "Concurrent" pada "[VP] Update Strategy" di "Pengaturan Spesifik", meskipun ada biaya penggunaan RAM. (default)
- Gunakan "Redraw_Fastest" pada pengaturan "Performance Drawing" (default)
- Gunakan MA Kustom (default)
- Setiap gambar yang terisi dan/atau teks cukup berat ketika jumlahnya banyak.
- Saat back-testing, beberapa gambar pada Grafik Berbasis Harga rusak, tetapi berfungsi dengan baik secara real-time.
- Pengaturan yang Disimpan disimpan di "Documents/cAlgo/LocalStorage/ODFT-AGG ..."
Fitur analisis baru dari Order Flow Ticks:
- Filter Spike Tick
-
- Moving Average atau Deviasi Standar.
- sebagai Ikon atau Bubbles.
- Level Spike.
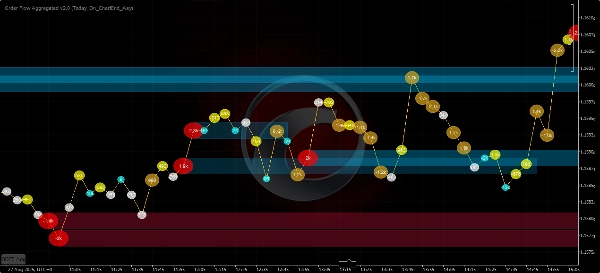
- Grafik Spike (Bubbles):
-
- Pewarnaan Heatmap.
- Pewarnaan Positif/Negatif.
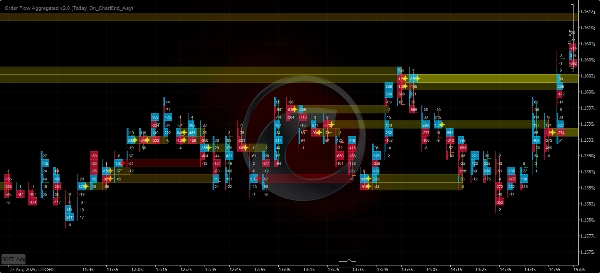
- Grafik Bubbles
-
- Moving Averages, Deviasi Standar, atau keduanya.
- [Volume Delta / Perubahan Delta Kumulatif / Kurangi Delta] sebagai sumber.
- Level Ultra Bubbles.
- Pewarnaan Heatmap.
- Pewarnaan Momentum:
-
- Memudar
- Positif/Negatif
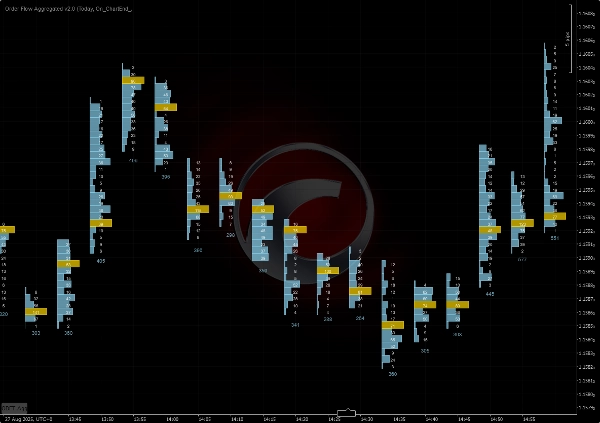
- Volume Profile
-
- Mini-VP - Dari 5 menit hingga 1 hari.
- Profil Harian, Mingguan, Bulanan!
- Profil Rentang Tetap.
=============================
Selalu utamakan versi dari toko cTrader, karena diperbarui terlebih dahulu.
Semua indikator yang saya kembangkan bersifat open source. Jika Anda tidak memiliki akses ke kode, lihat repositori Github
Ringkasan
Ringkasan AI
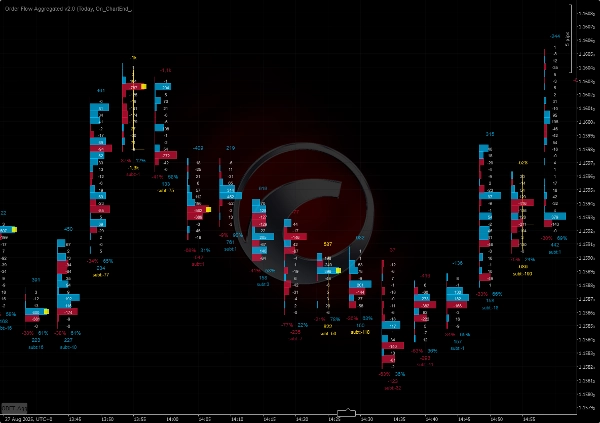
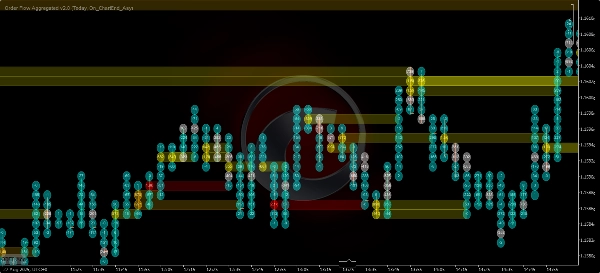
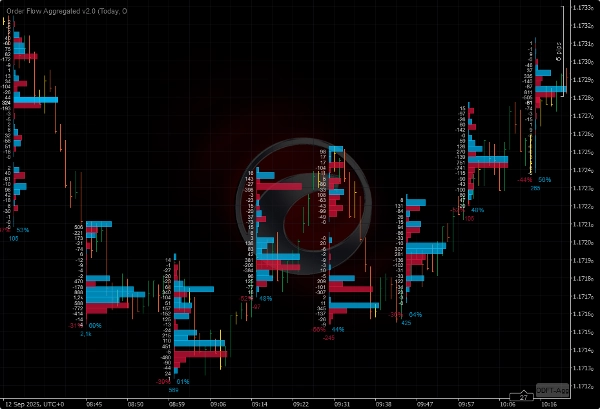
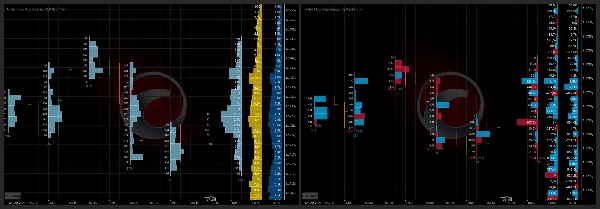
Order Flow Ticks v2.0 is an open-source indicator for the cTrader platform that adapts traditional Order Flow (Footprint) concepts to tick volume data. It supports multiple chart types including ticks, Renko, and range charts. The indicator offers several visualization modes: Normal Mode (volume profile per bar), Buy vs Sell Divided Mode (bid/ask footprint), Buy vs Sell Profile Mode, Delta Divided Mode (delta footprint), and Delta Profile Mode.
Version 2.0 introduces a parameters panel for quick switching between settings such as volume modes and row height, and it uses the Colors API exclusively. It is compatible with Mac OS and requires .NET 6.0 or higher.
Key features include:
- Tick Spike Filter with moving average or standard deviation, displayed as icons or bubbles with heatmap and positive/negative coloring.
- Bubbles Chart showing volume delta, cumulative delta change, or subtract delta with momentum coloring and ultra bubble levels.
- Volume Profile options including mini-profiles from 5 minutes to 1 day, daily, weekly, monthly, and fixed range profiles.
The indicator is optimized for performance to run efficiently on lower-end machines. It stores tick data in RAM and offers settings to balance performance and detail, including custom moving averages and concurrent update strategies. Saved settings are stored locally.
Profil indikator
Ulasan pelanggan
4.4
Ulasan: 23
5 | 74 % | |
4 | 13 % | |
3 | 4 % | |
2 | 0 % | |
1 | 9 % |
Ulasan pelanggan
May 13, 2026
Just a note to say thank you to the creator for making this free of charge. Appreciate it.
March 23, 2026
It's great, Thank you! Can you pls make an update, it doesnt work fully on Indices on CFD
March 9, 2026
"Thank you very much for your work on Order Flow Tick 2.0. It is truly excellent and unique."
October 22, 2025
this is great, i just can't see all the options because the panel is cut short. i don't have access to the bubbles and other features that are apparently there in the code
September 27, 2025
August 3, 2025
Amazing indicator! Once you learn how to use it it really helps out so much, love it!
July 9, 2025
Pros: Real-time tick flow visualization with buy/sell separation. Helps assess market activity and hidden liquidity. Easy to set up, works stable on major assets. Cons: No alerts on tick spikes. No history or tooltips. Requires experience to interpret data correctly.
July 3, 2025
June 20, 2025
Great indicator. It takes a bit of work to learn how to use it properly. Not to be used in isolation, you need to plan potential reversal zones.
April 15, 2025
This looks promising! I tested it out manually, but I would love to automate it! How could we get the source code? :) Really, Pls.
Diskusi
Pertanyaan umum
VWAP
Produk-produk yang tersedia melalui cTrader Store, termasuk bot trading, indikator, dan plugin, disediakan oleh pengembang pihak ketiga serta hanya ditujukan untuk akses teknis dan informasi. cTrader Store bukan broker dan tidak menyediakan saran investasi, rekomendasi pribadi, atau jaminan apa pun tentang kinerja di masa mendatang.


![Logo "[Stellar Strategies] Inside Bar with Signals"](https://cdn.ctrader.com/image/webp/1d9e8bfa-3b2c-4440-bb37-5856902008a7_30683)


Harga
Sejak 12/12/2024
1
Penjualan
33.22K
Instal gratis