


Penerangan
Penerangan:
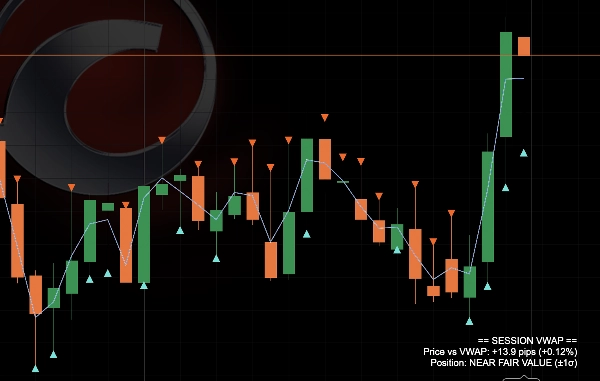
Session VWAP Bands melakar harga purata berwajaran volum yang dipautkan kepada sesi pilihan anda (reset harian secara lalai) bersama tiga tahap jalur sisihan statistik — rangka nilai adil yang sama digunakan pada meja ekuiti dan niaga hadapan institusi, dibawa ke carta forex runcit dan CFD.
Apa yang dianalisis: harga tipikal setiap bar (tinggi+rendah+tutup ÷ 3) yang diberi wajaran oleh volum, terkumpul dari permulaan sesi. Daripada itu ia menghasilkan VWAP berjalan dan sisihan piawai harga di sekelilingnya, kemudian meramalkan jalur 1σ, 2σ, dan 3σ di atas dan bawah.
Cara membacanya:
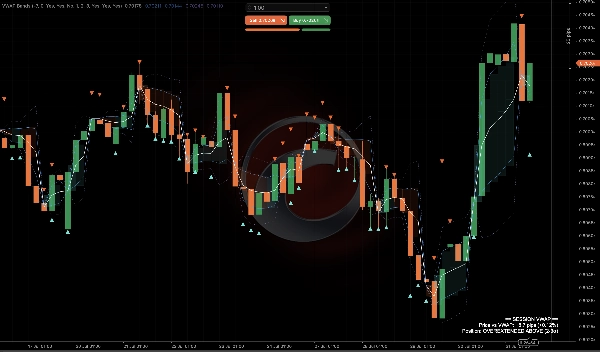
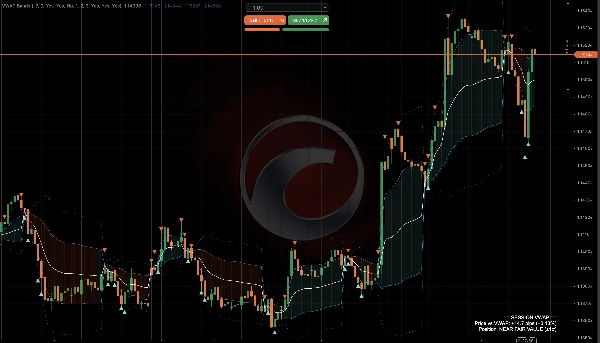
- Garis VWAP putih adalah nilai adil berwajaran volum sesi — harga di atasnya memihak kepada pembeli untuk sesi tersebut, di bawah memihak kepada penjual.
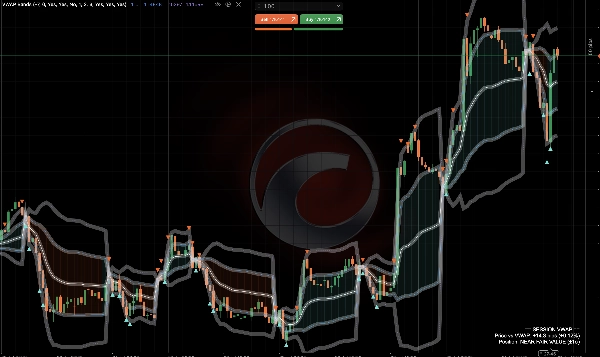
- Jalur dalaman (1σ, pepejal) menandakan julat dagangan normal di sekitar nilai adil.
- Jalur luar (2σ/3σ, bertitik) menandakan zon yang meregang secara statistik — harga jarang menghabiskan masa lama di luar ini tanpa kembali atau mencetuskan kesinambungan tren yang kuat.
- Awan gradasi lembut mewarnai ruang antara harga dan jalur pertama, berubah warna bergantung pada sisi VWAP yang harga sedang didagangkan — bacaan visual cepat tentang bias sesi.
- Penanda segitiga kecil dicetak secara automatik apabila harga melebihi jalur sisihan kedua dan ditutup kembali di dalam — isyarat untuk potensi pembalikan purata pada tahap ekstrem.
- Panel di sudut memberikan bacaan langsung dalam bahasa Inggeris mudah: jarak dari VWAP dalam pips dan %, serta label zon seperti "OVEREXTENDED ABOVE (2-3σ)."
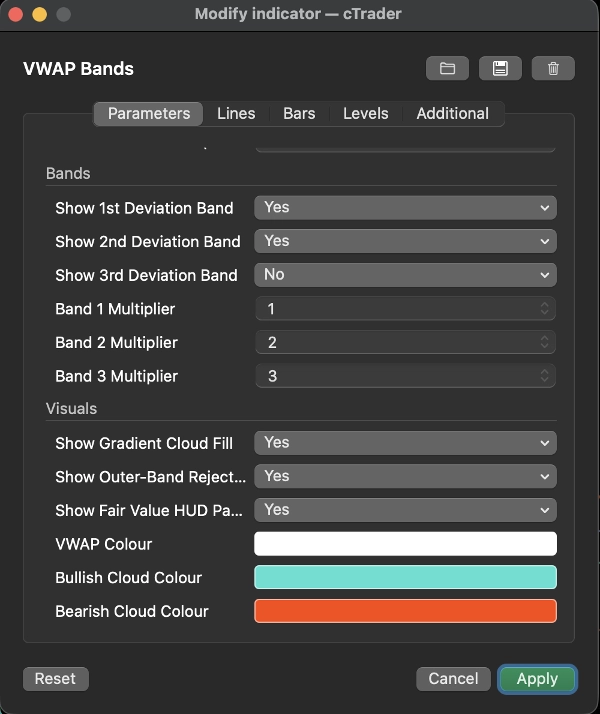
Tetapan utama: masa reset sesi (dengan offset masa pelayan ke NY untuk reset harian yang tepat), togol hidup/mati bebas dan pengganda tersuai untuk setiap tiga tahap jalur, togol isian awan dan penanda penolakan, serta penyesuaian warna penuh.
Kes penggunaan tipikal: menilai nilai adil intrahari pada indeks, forex utama, dan emas; mengurangkan pergerakan yang melampau kembali ke VWAP apabila harga menyentuh jalur luar; menggunakan VWAP sebagai sokongan/rintangan intrahari dinamik; mengesahkan sama ada pecahan berlaku dari titik permulaan "meregang" atau "nilai adil".
Sesuai untuk: pedagang intrahari dan scalping yang mahukan bacaan nilai adil yang objektif dan berasaskan statistik berbanding garis statik — berguna untuk pembentukan bias secara budi bicara dan sebagai alat konfluens bersama set up lain. Kurang relevan untuk pedagang posisi jangka panjang tulen.
Ringkasan
The indicator calculates each bar’s typical price (average of high, low, and close) weighted by volume from the session start, deriving the running VWAP and standard deviation. The white VWAP line represents the session’s fair value, with price above favoring buyers and below favoring sellers. The inner bands mark normal trading ranges, while outer bands indicate statistically stretched price zones that often precede reversions or strong trend continuations.
Visual features include a gradient cloud shading between price and the first band, changing color based on price position relative to VWAP, and triangle markers signaling price rejection beyond the second deviation band, suggesting potential mean reversion. A corner panel displays live metrics such as distance from VWAP in pips and percentage, plus zone labels like "OVEREXTENDED ABOVE (2-3σ)."
Key settings allow customization of session reset time, band multipliers, cloud and marker toggles, and colors. VWAP Bands is suited for intraday and scalping traders seeking an objective, statistically grounded measure of fair value and dynamic support/resistance.
Perbincangan
Ulasan pelanggan
Soalan Lazim
Lebih banyak produk daripada penulis ini















![Logo "Gaussian Channel [Iridio Capital]"](https://cdn.ctrader.com/image/webp/2c4f9ca9-4e9b-476d-b5a6-787c8095032b_61546)














Harga