
VolumeRenkoRange
อินดิเคเตอร์
1.41K ดาวน์โหลด
เวอร์ชัน 1.1, Jan 2026
Windows, Mac
5.0
รีวิว: 1
คำอธิบาย
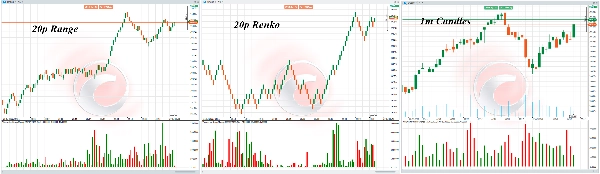
VolumeRenkoRange ใช้ตรรกะปริมาณ tick บนแผนภูมิที่อิงราคาตามราคา
ใช้ข้อมูล Tick ในการคำนวณปริมาณ เหมือนกับแท่งเทียน
เป็นไปได้เพราะเรามีเวลาเปิด/ปิดของแท่ง ดังนั้น:
ตรรกะปริมาณ = จำนวนการอัปเดตราคา (ticks) ในระหว่างการก่อตัวของแท่ง (ระหว่างเวลาเปิดและเวลาปิด)
มีอะไรใหม่ใน rev.1?
รวมการปรับปรุงที่เกี่ยวข้องกับ "Order Flow Aggregated" ทั้งหมด
- VolumeTick() ประสิทธิภาพสูง
- การเก็บข้อมูล Tick แบบอะซิงโครนัส
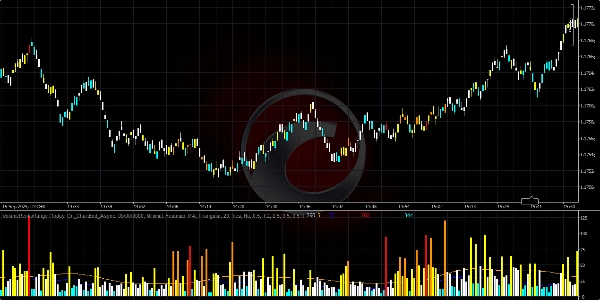
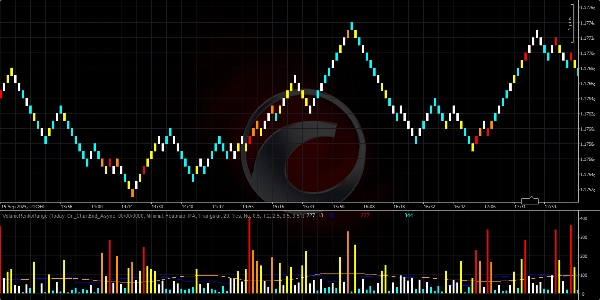
- การระบายสี Heatmap/Fading
สรุป
สรุปโดย AI
VolumeRenkoRange is an indicator designed for price-based charts such as Renko and Range charts. It applies tick volume logic by calculating the number of price updates (ticks) that occur during the formation of each bar, using the bar's open and close times. This approach enables volume measurement on non-time-based charts similarly to traditional candlestick charts. The indicator incorporates high-performance tick volume calculation, asynchronous tick data collection, and visual enhancements like heatmap and fading coloring to represent volume intensity. It is part of a suite of cTrader Store indicators focused on order flow and volume analysis.
โปรไฟล์อินดิเคเตอร์
รีวิวจากลูกค้า
5.0
รีวิว: 1
5 | 100 % | |
4 | 0 % | |
3 | 0 % | |
2 | 0 % | |
1 | 0 % |
รีวิวจากลูกค้า
July 9, 2025
Pros: Displays volume-based Renko blocks, filtering noise and highlighting impulsive moves. Flexible settings, stable performance. Cons: No tooltips or alerts. No template saving. Requires additional confirmation tools for reliable trading decisions.
การสนทนา
คำถามที่พบบ่อย
VWAP
ผลิตภัณฑ์ที่มีให้บริการผ่าน cTrader Store รวมถึงบอทการเทรด อินดิเคเตอร์ และปลั๊กอิน มีให้บริการโดยนักพัฒนาบุคคลที่สามและมีไว้เพื่อวัตถุประสงค์ในการเข้าถึงข้อมูลและทางเทคนิคเท่านั้น cTrader Store ไม่ใช่โบรกเกอร์และไม่ได้ให้คำแนะนำการลงทุน คำแนะนำส่วนบุคคล หรือการรับประกันผลการดำเนินงานในอนาคต


ราคา
ตั้งแต่ 12/12/2024
1
การขาย
33.31K
ติดตั้งฟรี