
Order Flow Ticks v2.0
อินดิเคเตอร์
12.08K ดาวน์โหลด
เวอร์ชัน 1.1, Jan 2026
Windows, Mac
4.4
รีวิว: 23
คำอธิบาย
คำอธิบายล่าสุด -> 11/11/2025
ทุกแง่มุมของ Order Flow Ticks (เวอร์ชันรวม) ได้รับการออกแบบอย่างพิถีพิถันโดยคำนึงถึง ประสิทธิภาพ เพื่อให้สามารถทำงานได้แม้ในเครื่องที่มีสเปกต่ำกว่า
อย่างไรก็ตาม นี่คือ "เคล็ดลับและเทคนิค" สำหรับการใช้งานที่ดียิ่งขึ้น:
- ข้อมูล Tick ถูกเก็บไว้ใน RAM แม้ว่า cTrader จะมีการจัดการหน่วยความจำที่ดีอยู่แล้ว:
-
- โหลดเฉพาะสิ่งที่จำเป็นจริง ๆ สำหรับการเทรดสด
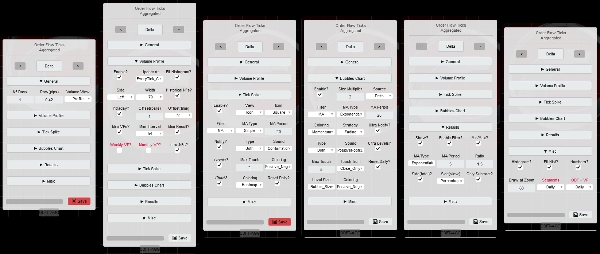
- แผงพารามิเตอร์ แสดงพารามิเตอร์ที่รองรับโดยแต่ละโหมดแล้ว
- ช่วงเซกเมนต์ อาจเปลี่ยนการวิเคราะห์ตัวกรอง ใช้ช่วง รายวัน สำหรับโมเมนตัมภายในวัน
- ที่ กรอบเวลาที่สูงกว่า (รวมถึงกราฟแบบราคา)
-
- ตั้งค่า ODF + VP เป็น รายสัปดาห์
- จำนวนวัน / รีเซ็ตรายวัน? พารามิเตอร์ตอนนี้เป็น สัปดาห์/รายสัปดาห์
- ตัวกรองทั้งหมดจะถูกรีเซ็ตทุกสัปดาห์แทนที่จะเป็นทุกวัน
- "กรอบเวลาที่ต่ำกว่า" พร้อม "ขนาดแถวเล็ก":
-
- ค่าเฉลี่ยเคลื่อนที่แบบกำหนดเอง ถูกสร้างขึ้นเพื่อเร่งการคำนวณใหม่เมื่อ เปลี่ยนการตั้งค่า ที่ แผงพารามิเตอร์
- ถ้าคุณต้องการใช้ ค่าเฉลี่ยเคลื่อนที่ของ cTrader ให้ตั้ง [ODF] ใช้ค่าเฉลี่ยเคลื่อนที่แบบกำหนดเอง? เป็น เท็จ
-
- โปรดอดทนหากตัวกรองใด ๆ [ผลลัพธ์ / สไปค์ / ฟอง] ถูกเปิดใช้งาน
- ถ้า ต้องการประสิทธิภาพสูง:
-
- ปิดใช้งานโปรไฟล์ปริมาณและ/หรือใช้ Mini-VPs แทน (ค่าเริ่มต้น)
- ใช้ "Concurrent" ใน "[VP] กลยุทธ์อัปเดต" ที่ "การตั้งค่าเฉพาะ" แม้ว่าจะมีค่าใช้จ่ายในการใช้ RAM (ค่าเริ่มต้น)
- ใช้ "Redraw_Fastest" ในการตั้งค่า "การวาดภาพประสิทธิภาพ" (ค่าเริ่มต้น)
- ใช้ค่าเฉลี่ยเคลื่อนที่แบบกำหนดเอง (ค่าเริ่มต้น)
- การวาดภาพที่เติมเต็มและ/หรือข้อความจะหนักมากเมื่อมีจำนวนมาก
- เมื่อทดสอบย้อนหลัง การวาดภาพบางอย่างบนกราฟแบบราคาอาจเสียหาย แต่ทำงานได้ดีในเวลาจริง
- การตั้งค่าที่บันทึกไว้ จะถูกเก็บไว้ที่ "Documents/cAlgo/LocalStorage/ODFT-AGG ..."
ฟีเจอร์การวิเคราะห์ใหม่ของ Order Flow Ticks:
- ตัวกรองสไปค์ Tick
-
- ค่าเฉลี่ยเคลื่อนที่หรือส่วนเบี่ยงเบนมาตรฐาน
- ในรูปแบบไอคอนหรือฟอง
- ระดับสไปค์
- กราฟสไปค์ (ฟอง):
-
- การระบายสีแบบฮีทแมป
- การระบายสีบวก/ลบ
- กราฟฟอง
-
- ค่าเฉลี่ยเคลื่อนที่, ส่วนเบี่ยงเบนมาตรฐาน หรือทั้งสองอย่าง
- [Volume Delta / Cumulative Delta Change / Subtract Delta] เป็นแหล่งข้อมูล
- ระดับฟองอัลตร้า
- การระบายสีแบบฮีทแมป
- การระบายสีโมเมนตัม:
-
- จางลง
- บวก/ลบ
- โปรไฟล์ปริมาณ
-
- Mini-VPs - ตั้งแต่ 5 นาทีถึง 1 วัน
- โปรไฟล์รายวัน รายสัปดาห์ รายเดือน!
- โปรไฟล์ช่วงคงที่
=============================
ควรเลือกใช้เวอร์ชันจากร้านค้า cTrader เสมอ เพราะจะได้รับการอัปเดตก่อน
ตัวชี้วัดทั้งหมด ที่ผมพัฒนาขึ้น เป็นโอเพ่นซอร์ส หากคุณไม่สามารถเข้าถึงโค้ดได้ โปรดดูที่ ที่เก็บ Github
สรุป
สรุปโดย AI
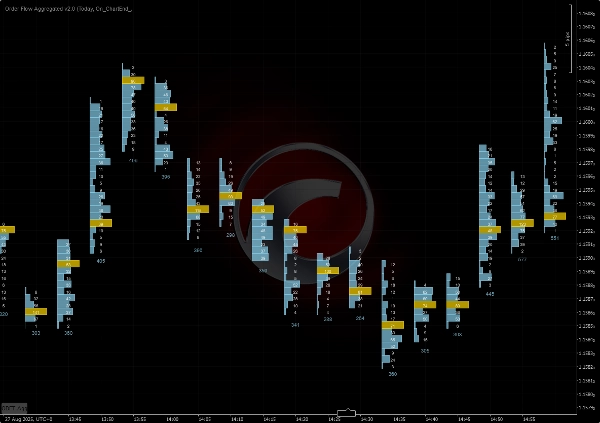
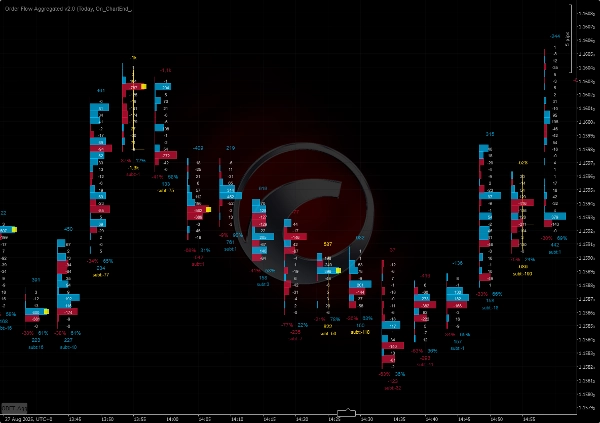
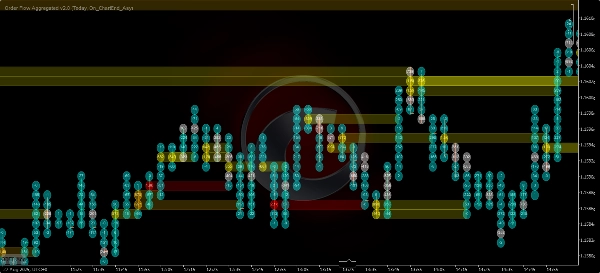
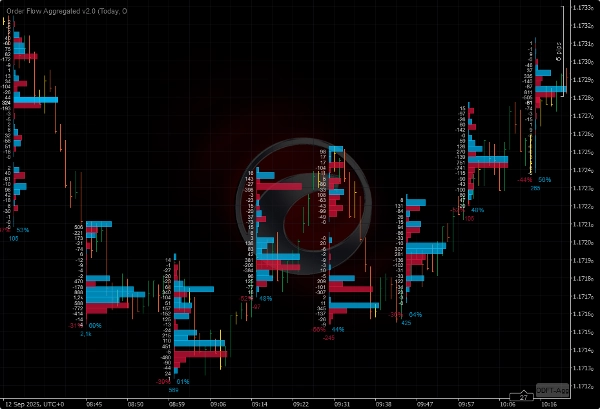
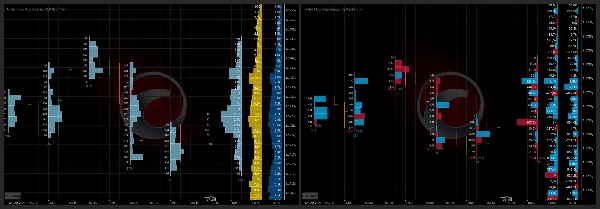
Order Flow Ticks v2.0 is an open-source indicator for the cTrader platform that adapts traditional Order Flow (Footprint) concepts to tick volume data. It supports multiple chart types including ticks, Renko, and range charts. The indicator offers several visualization modes: Normal Mode (volume profile per bar), Buy vs Sell Divided Mode (bid/ask footprint), Buy vs Sell Profile Mode, Delta Divided Mode (delta footprint), and Delta Profile Mode.
Version 2.0 introduces a parameters panel for quick switching between settings such as volume modes and row height, and it uses the Colors API exclusively. It is compatible with Mac OS and requires .NET 6.0 or higher.
Key features include:
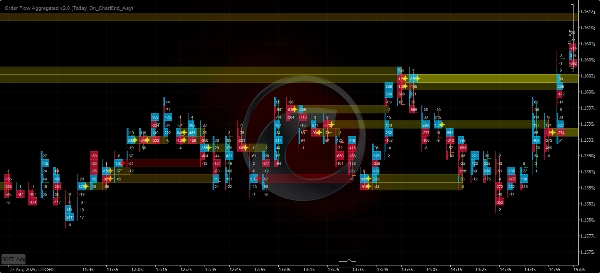
- Tick Spike Filter with moving average or standard deviation, displayed as icons or bubbles with heatmap and positive/negative coloring.
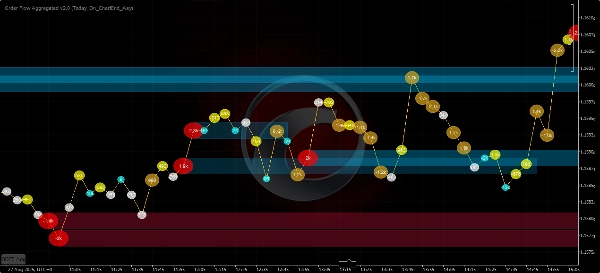
- Bubbles Chart showing volume delta, cumulative delta change, or subtract delta with momentum coloring and ultra bubble levels.
- Volume Profile options including mini-profiles from 5 minutes to 1 day, daily, weekly, monthly, and fixed range profiles.
The indicator is optimized for performance to run efficiently on lower-end machines. It stores tick data in RAM and offers settings to balance performance and detail, including custom moving averages and concurrent update strategies. Saved settings are stored locally.
Version 2.0 introduces a parameters panel for quick switching between settings such as volume modes and row height, and it uses the Colors API exclusively. It is compatible with Mac OS and requires .NET 6.0 or higher.
Key features include:
- Tick Spike Filter with moving average or standard deviation, displayed as icons or bubbles with heatmap and positive/negative coloring.
- Bubbles Chart showing volume delta, cumulative delta change, or subtract delta with momentum coloring and ultra bubble levels.
- Volume Profile options including mini-profiles from 5 minutes to 1 day, daily, weekly, monthly, and fixed range profiles.
The indicator is optimized for performance to run efficiently on lower-end machines. It stores tick data in RAM and offers settings to balance performance and detail, including custom moving averages and concurrent update strategies. Saved settings are stored locally.
โปรไฟล์อินดิเคเตอร์
รีวิวจากลูกค้า
4.4
รีวิว: 23
5 | 74 % | |
4 | 13 % | |
3 | 4 % | |
2 | 0 % | |
1 | 9 % |
รีวิวจากลูกค้า
May 13, 2026
Just a note to say thank you to the creator for making this free of charge. Appreciate it.
March 23, 2026
It's great, Thank you! Can you pls make an update, it doesnt work fully on Indices on CFD
March 9, 2026
"Thank you very much for your work on Order Flow Tick 2.0. It is truly excellent and unique."
October 22, 2025
this is great, i just can't see all the options because the panel is cut short. i don't have access to the bubbles and other features that are apparently there in the code
September 27, 2025
August 3, 2025
Amazing indicator! Once you learn how to use it it really helps out so much, love it!
July 9, 2025
Pros: Real-time tick flow visualization with buy/sell separation. Helps assess market activity and hidden liquidity. Easy to set up, works stable on major assets. Cons: No alerts on tick spikes. No history or tooltips. Requires experience to interpret data correctly.
July 3, 2025
June 20, 2025
Great indicator. It takes a bit of work to learn how to use it properly. Not to be used in isolation, you need to plan potential reversal zones.
April 15, 2025
This looks promising! I tested it out manually, but I would love to automate it! How could we get the source code? :) Really, Pls.
การสนทนา
คำถามที่พบบ่อย
VWAP
ผลิตภัณฑ์ที่มีให้บริการผ่าน cTrader Store รวมถึงบอทการเทรด อินดิเคเตอร์ และปลั๊กอิน มีให้บริการโดยนักพัฒนาบุคคลที่สามและมีไว้เพื่อวัตถุประสงค์ในการเข้าถึงข้อมูลและทางเทคนิคเท่านั้น cTrader Store ไม่ใช่โบรกเกอร์และไม่ได้ให้คำแนะนำการลงทุน คำแนะนำส่วนบุคคล หรือการรับประกันผลการดำเนินงานในอนาคต


ราคา
ตั้งแต่ 12/12/2024
1
การขาย
33.19K
ติดตั้งฟรี