
Support Resistance Zones
지표
1.81K 다운로드
버전 1.0, Apr 2025
Windows, Mac
5.0
리뷰: 4
설명
요약
AI 요약
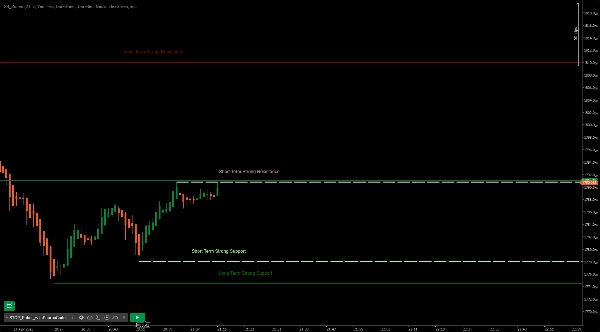
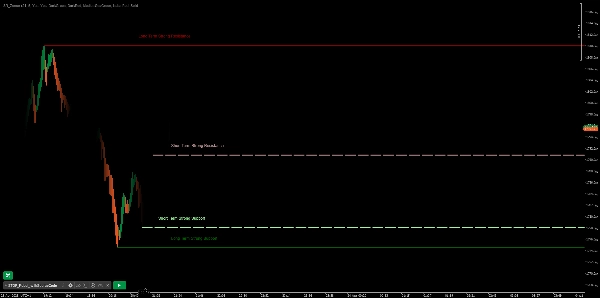
Support Resistance Zones is a trading indicator designed to identify key support and resistance levels on price charts. It distinguishes between short and long support/resistance zones and categorizes them as strong or minor resistance areas. This tool helps traders visualize critical price levels where market reversals or consolidations may occur, aiding in technical analysis and decision-making.
지표 프로필
고객 리뷰
5.0
리뷰: 4
5 | 100 % | |
4 | 0 % | |
3 | 0 % | |
2 | 0 % | |
1 | 0 % |
고객 리뷰
December 21, 2025
December 18, 2025
100% Amazing tool for a beginner like me who makes 90% Wins and 90% Losses, Now just Wins and losses because I get bored - Thank YOU so much for this tool.
July 14, 2025
Pros: Automatically detects support and resistance zones. Customizable and visually clear. Works across all timeframes. Cons: No alerts or tooltips. Lacks volume-based filtering and template saving. Needs confirmation tools for reliable signals.
상담
자주 묻는 질문(FAQ)
트레이딩 봇, 지표, 플러그인 등 cTrader Store에서 제공되는 상품은 제3자 개발자에 의해 제공되며, 이는 단순히 정보 및 기술적 접근을 목적으로 제공된 것입니다. cTrader Store는 중개인이 아니며, 투자 조언, 개인별 추천 또는 향후 성과에 대한 어떠한 보장도 제공하지 않습니다.
좋아하실 만한 다른 항목


가격
가입일 09/01/2025
11.78K
무료 설치