
LT_Ind_Candles
อินดิเคเตอร์
4 การซื้อ
เวอร์ชัน 1.0, Sep 2024
Windows, Mac
4.0
รีวิว: 1
คำอธิบาย
หมายเหตุ: ทดสอบบน cTrader Windows เท่านั้น
รูปแบบแท่งเทียนเดี่ยว:
- Doji
- Hammer
- Shooting Star
รูปแบบแท่งเทียน 2 แท่ง:
- Engulf
- DarkCloud
- Piercing
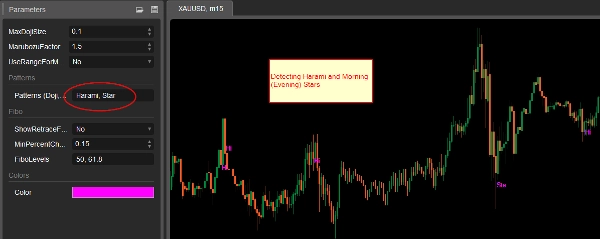
- Harami
รูปแบบแท่งเทียน 3 แท่ง:
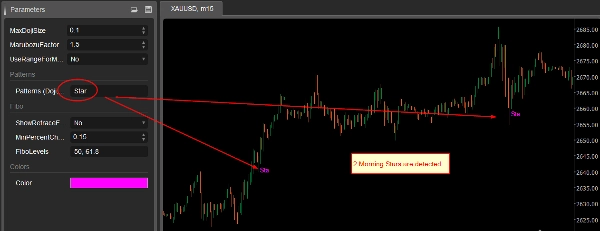
- Morning Stars
- Eveving Stars
Marubozu:
ถ้าเลือก จะมีการระบุขนาดของแท่งเทียนที่มีตัวแทนขนาดใหญ่ อ่านคำอธิบายการตั้งค่าเกี่ยวกับขนาด
การตั้งค่า:
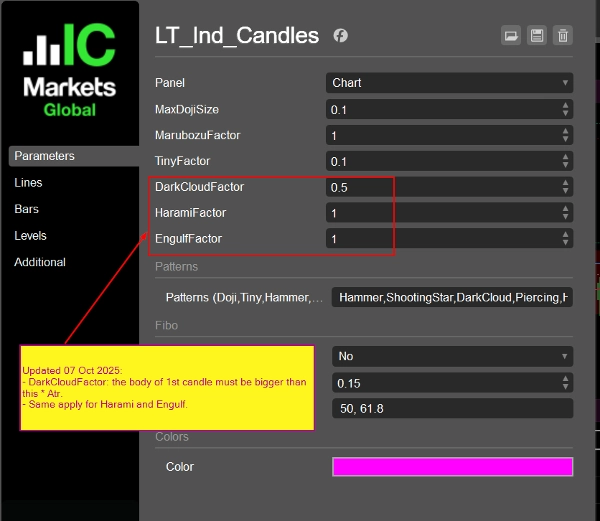
(อัปเดต 07 ต.ค. 2025:
- ใช้ Atr (14 ช่วงเวลา, ค่าเฉลี่ยเคลื่อนที่แบบง่าย) แทน MedianBarBody
- เพิ่มการตั้งค่าสำหรับ DarkCloud (และ Piercing), Harami, ปัจจัย Engulf
)
- MaxDojiSize: อัตราส่วนสูงสุดระหว่างตัวแทนแท่งเทียนกับช่วงแท่งเทียนเพื่อพิจารณาว่าเป็น Doji (ค่าเริ่มต้น 0.1)
- ปัจจัย Marubozu: ตัวแทนแท่งเทียนของแท่งปัจจุบันต้อง > MarubozuFactor * Atr เพื่อพิจารณาว่าเป็นแท่งเทียนขนาดใหญ่ (Marubozu) เราไม่สนใจไส้เทียนที่นี่
- ใช้ช่วงแท่งเทียนสำหรับ Marubozu: ใช้ BarRange (สูง - ต่ำ) แทน BarBody (เปิด - ปิด).MathAbs() เมื่อเช็ค Marubozu
- รูปแบบ: ใส่รูปแบบที่คุณต้องการตรวจจับ คั่นด้วยเครื่องหมายจุลภาค ค่าที่ยอมรับได้คือ: Doji,Hammer,ShootingStar,Engulf,DarkCloud,Piercing,Harami,Star,Marubozu โปรดทราบว่าถ้าเลือก "Star" จะตรวจจับ Morning Stars และ Evening Stars ทั้งคู่
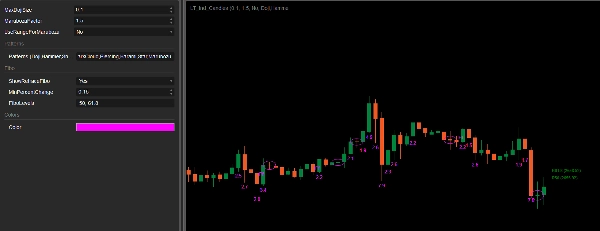
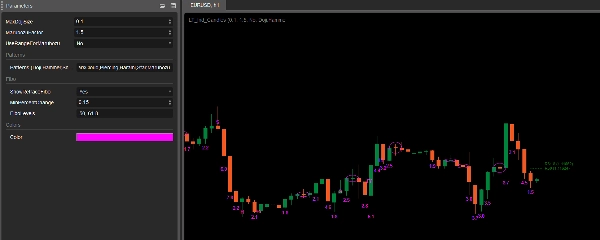
- แสดง Retrace Fibo: ระดับ Fibo ช่วยเหลือเพื่อช่วยควบคุมความเสี่ยง เมื่อมีแท่งเทียน 2 แท่งติดต่อกันที่มีจุดสูงสุดและต่ำสุดสูงขึ้น ระดับ Fibo ที่คำนวณจากแท่งเทียน 2 แท่งนั้นจะถูกแสดง คุณสามารถถือการเข้าเทรดจนกว่าราคาจะถึงระดับเหล่านี้เพื่อควบคุมความเสี่ยง ระดับเหล่านี้สามารถตั้งค่าได้ ด้านตรงข้ามก็เหมือนกัน (จุดสูงสุดและต่ำสุดต่ำลง)
- เปอร์เซ็นต์การเปลี่ยนแปลงขั้นต่ำ: แท่งเทียน 2 แท่งที่ใช้สำหรับระดับ Fibo ต้องมีการเปลี่ยนแปลงราคามากกว่าเปอร์เซ็นต์นี้
- ระดับ Fibo: ใส่ระดับของคุณโดยคั่นด้วยเครื่องหมายจุลภาค
- สี: สีของการระบุแท่งเทียน
สรุป
โปรไฟล์อินดิเคเตอร์
รีวิวจากลูกค้า
4.0
รีวิว: 1
5 | 0 % | |
4 | 100 % | |
3 | 0 % | |
2 | 0 % | |
1 | 0 % |
การสนทนา
คำถามที่พบบ่อย
Forex
Signal
Indices
Commodities
Crypto
Stocks
ATR
ผลิตภัณฑ์ที่มีให้บริการผ่าน cTrader Store รวมถึงบอทการเทรด อินดิเคเตอร์ และปลั๊กอิน มีให้บริการโดยนักพัฒนาบุคคลที่สามและมีไว้เพื่อวัตถุประสงค์ในการเข้าถึงข้อมูลและทางเทคนิคเท่านั้น cTrader Store ไม่ใช่โบรกเกอร์และไม่ได้ให้คำแนะนำการลงทุน คำแนะนำส่วนบุคคล หรือการรับประกันผลการดำเนินงานในอนาคต


ราคา
ตั้งแต่ 25/09/2024
34
การขาย