
Zigzag T3
อินดิเคเตอร์
2 การซื้อ
เวอร์ชัน 1.0, Sep 2024
Windows, Mac
4.5
รีวิว: 2
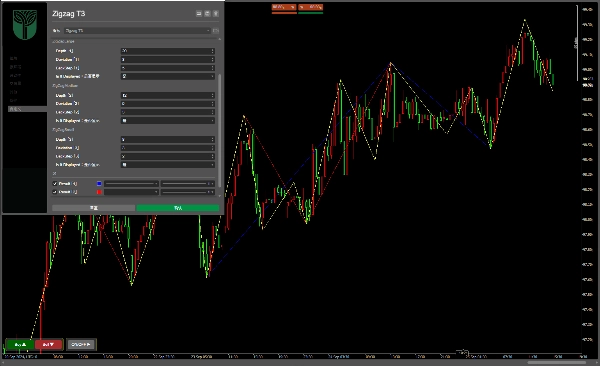
คำอธิบาย
สามเส้นซิกแซก
สามารถปิดหรือเปิดหนึ่งหรือมากกว่าหนึ่งเส้นได้
สรุป
โปรไฟล์อินดิเคเตอร์
รีวิวจากลูกค้า
4.5
รีวิว: 2
5 | 50 % | |
4 | 50 % | |
3 | 0 % | |
2 | 0 % | |
1 | 0 % |
การสนทนา
คำถามที่พบบ่อย
ผลิตภัณฑ์ที่มีให้บริการผ่าน cTrader Store รวมถึงบอทการเทรด อินดิเคเตอร์ และปลั๊กอิน มีให้บริการโดยนักพัฒนาบุคคลที่สามและมีไว้เพื่อวัตถุประสงค์ในการเข้าถึงข้อมูลและทางเทคนิคเท่านั้น cTrader Store ไม่ใช่โบรกเกอร์และไม่ได้ให้คำแนะนำการลงทุน คำแนะนำส่วนบุคคล หรือการรับประกันผลการดำเนินงานในอนาคต
เพิ่มเติมจากผู้เขียนคนนี้


ราคา
ตั้งแต่ 11/09/2024
4
การขาย
58
ติดตั้งฟรี