
คำอธิบาย
🧭 จับเวลาการเทรดของคุณตามนาฬิกา: Atlas เปิดเผยว่าเมื่อตลาดมักจะเคลื่อนไหวตามเดือน วันในสัปดาห์ และชั่วโมง 🧭
ดูว่าเมื่อตลาดของคุณมักจะเคลื่อนไหว — ตามเดือน วันในสัปดาห์ หรือชั่วโมงของวัน
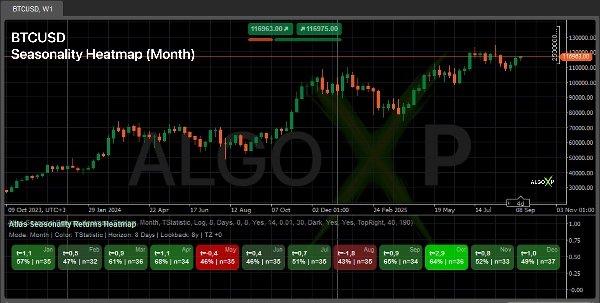
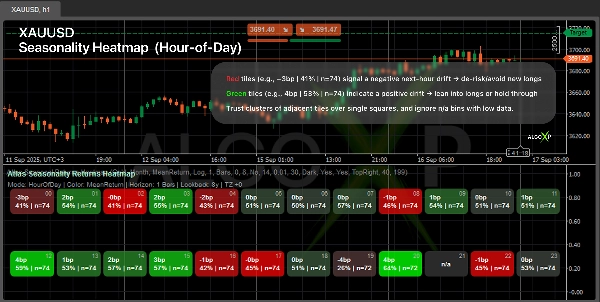
Atlas คำนวณ ผลตอบแทนล่วงหน้า ในช่วงเวลาที่คุณเลือกและวาด แผนที่ความร้อนสมมาตร (ลง → ศูนย์ → ขึ้น) แต่ละช่องแสดงเมตริก (ค่าเฉลี่ย, ค่า T-stat หรือ ค่า Sharpe) พร้อมกับ เปอร์เซ็นต์การชนะ | n ใช้เพื่อ จับเวลาการเข้า/ออก, วางแผนเซสชัน และ กรองความเสี่ยง.
🎯 เหตุผลที่เทรดเดอร์ใช้
- สังเกต หน้าต่างสีเขียว เพื่อเข้าเทรด และ หน้าต่างสีแดง เพื่อถอยออก.
- วางแผนเซสชันรอบๆ ชั่วโมง/วันที่มีสถิติเป็นบวก.
- เพิ่มชั้น “เมื่อไหร่” ให้กับกลยุทธ์แบบเลือกและแบบระบบ.
⚙️ วิธีการทำงาน
- มองไปข้างหน้าภายใน ช่วงเวลาที่คุณเลือก และสรุปว่าราคามักจะมีพฤติกรรมอย่างไรในช่วงเวลานั้น.
- จัดกลุ่มผลลัพธ์เป็น ถังเวลา (เดือน / วันในสัปดาห์ / ชั่วโมง) และ เคารพโซนเวลาของคุณ.
- ใช้ การป้องกันค่าผิดปกติ และคะแนนความแข็งแกร่งที่ มั่นคง ต่อถัง (พร้อมขนาดตัวอย่าง).
- วาด แผนที่ความร้อนที่สมดุล รอบค่ากลางโดยใช้สี ขึ้น / ศูนย์ / ลง ของคุณ.
👥 สำหรับใคร
- เทรดเดอร์แบบเลือก — จับเวลาและขนาดที่ดีกว่าในแต่ละเซสชัน.
- ผู้สร้างระบบและบอท — ชั้น ตัวกรองเวลา / การกำหนดขนาดเวลาที่ สำหรับกลยุทธ์.
- เทรดเดอร์คริปโตและดัชนี — รูปแบบพฤติกรรมรวดเร็วในวัน/ชั่วโมง.
- ผู้เริ่มต้น — อ่านง่าย: สีเขียวมากขึ้น = แนวโน้มบวกมากขึ้นในช่วงเวลาที่คุณเลือก.
🚀 เริ่มต้นอย่างรวดเร็ว
- เลือก การตั้งค่าทรัพย์สิน (Forex/Crypto/Index/Gold).
- ตั้งค่า ช่วงเวลา (เช่น, 1 ชั่วโมง สำหรับ HOD, 1 วัน สำหรับ DOW/เดือน).
- ปรับแต่ง Lookback, จำนวนการสังเกตขั้นต่ำ และสี.
- อ่านกลุ่ม (ช่องสีเขียว/แดงที่ติดกันหลายช่อง) เพื่อหาสัญญาณที่แข็งแกร่งที่สุด.
ℹ️ ฤดูกาลไม่ได้รับประกันผลลัพธ์ในอนาคต มันเป็นรูปแบบทางสถิติที่ขึ้นอยู่กับช่วงเวลาและวิธีการ ใช้ตัวชี้วัดนี้เป็น บริบท สำหรับกฎการเข้า/ออกและการจัดการความเสี่ยงของคุณ ทดสอบ ความมั่นคงในหลายช่วงเวลาการดูย้อนหลัง และหลีกเลี่ยงการพึ่งพาช่องที่มี จำนวนตัวอย่างน้อย.
สรุป
The indicator supports multiple asset presets including Forex, Crypto, Indices, and Commodities, and respects the user’s timezone. It applies outlier protection and calculates a robust strength score per time bucket to ensure reliable insights. Users can customize parameters like lookback period, minimum observations, and color schemes.
Atlas is suitable for discretionary traders seeking better timing and sizing, system and bot builders needing a time-based filter or sizing layer, crypto and index traders analyzing behavioral patterns, and beginners looking for a straightforward indication of positive or negative market bias. It provides a statistical context for entry/exit decisions and risk management but should be used alongside other analysis tools.
รีวิวจากลูกค้า
5 | 50 % | |
4 | 50 % | |
3 | 0 % | |
2 | 0 % | |
1 | 0 % |


!["[Hamster-Coder] Bollinger Bands" โลโก้](https://cdn.ctrader.com/image/webp/21d8e5d6-fb11-4bac-b9ee-cd05c2b76804_30327)

!["[Hamster-Coder] Moving Average MTF" โลโก้](https://cdn.ctrader.com/image/webp/b11b98b1-194d-4b8e-b00e-d611826ad159_31226)


